How to : Using Trello On Project Management

Yeaaay, so excited

On this section i will shared How to : Using Trello On Project Management

i writting this tutorial using Bahasa,  you can download the Document on the link below

TRELLO

hope this article can be Helpfull for you..

Sharing is Learning, please give a correction when some my statement its not correct

and put a comment .


Thank You

OpenDaylight Installation and Integration to Mininet emulator

OpenDaylight_logo

Hi guys,

On the previous article i was writing about SDN Concept using Mininet emulator, now we will explore  about OpenDaylight Platform, wait…what is that?? OpenDaylight Platform previously  named OpenDaylight Controller, so basicly OpenDaylight is open source SDN controller hosted by linux foundation.

The OpenDaylight Controller exposes open northbound APIs, which are used by applications. These applications use the Controller to collect information about the network, run algorithms to conduct analytics, and then use the OpenDaylight Controller to create new rules throughout the network. (Source : sdxcentrall.com)

for the southbound communication OpenDaylight includes support for the OpenFlow protocol, but can also support other open SDN standards (Remember 3 Layer architecture Of SDN concept)

okay, the main point of this article i will try to install OpenDaylight Platform as SDN controller to my mininet emulator which I have installed before (you can read how to installed mininet on the previous article)

as usuall i will installed OpenDaylight on my ubuntu 14.04  AMD64 with minimum specification, because this is for testing purposes

a. Specification Requirement:

CPU : 2 Core

RAM : 4 GB

DISK : 40 GB

b. Software Requirement :

Latest Java  (Ver 7 – 8)  because OpenDaylight Platform writing used JAVA Programming language)

apache-maven-3.3.3

OpenDaylight Package

c. Installation Step :

1. Update Repository and Install JAVA 8:

#sudo add-apt-repository ppa:webupd8team/java -y
#sudo apt-get update
#sudo apt-get install oracle-java8-installer

2. Download Maven package and  Configure to the system

Downoad pakage maven used command

#wget https://repo.maven.apache.org/maven2/org/apache/maven/apache-maven/3.3.3/apache-maven-3.3.3-bin.tar.gz

create folder “apache-maven” on directory /usr/local

#mkdir -p /usr/local/apache-maven/

move package maven to folder directory apache-maven

#mv apache-maven-3.3.3-bin.tar.gz /usr/local/apache-maven/

extract package maven with command :

#tar -xzvf /usr/local/apache-maven/apache-maven-3.3.3-bin.tar.gz -C /usr/local/apache-maven/

Configure maven
# sudo update-alternatives –install /usr/bin/mvn mvn /usr/local/apache-maven/apache-maven-3.3.3/bin/mvn 1
# sudo update-alternatives –config mvn

3. Configures ~/.Bashrc  to update path of your JAVA home Directory and Maven Directory

# sudo apt-get install vim
# vim ~/.bashrc

Add this on the end of line

export M2_HOME=/usr/local/apache-maven/apache-maven-3.3.3
export MAVEN_OPTS=”-Xms256m -Xmx512m”
export JAVA_HOME=/usr/lib/jvm/java-8-oracle

used config ~/.bashrc to your system

#source ~/.bashrc

4. and check your Java Home Directory with command

#echo $JAVA_HOME

5. Next we will download OpenDaylight Package from their website, i choose new update ODL “Carbon SR1” on “July 14, 2017”

#wget https://nexus.opendaylight.org/content/repositories/public/org/opendaylight/integration/distribution-karaf/0.6.1-Carbon/distribution-karaf-0.6.1-Carbon.zip

before we start OpenDaylight Controlelr, if you already have openvswitch on your system, stop the service with comamnd

#service openvswitch-controller stop

#service openvswitch-switch stop

6. Next step we will start OpenDaylight Controller, first unzip OpenDaylight package we have downloaded

#unzip distribution-karaf-0.6.1-Carbon.zip

7. Run OpenDaylight with command

#cd /distribution-karaf-0.6.1-Carbon/bin

#./karaf

ODL

on this step, we have success running OpenDaylight SDN controller on our linux system, next from the OpenDaylight comamnd line we will install odl-l2switch and OpenDaylight User Experience (DLUX) application.  DLUX is an openflow network management application for Opendaylight controller. this installation feature to add web interface on OpenDaylight Platform, can login to web interface and control Southbound connections to OVS (Open Virtual Switch) with OVSDB to learn MAC address from host connected to the switch

8. Install feature needed by opendaylight

opendaylight-user@root>feature:install odl-l2switch-switch-ui

opendaylight-user@root>odl-dlux-core
opendaylight-user@root>odl-dluxapps-nodes
opendaylight-user@root>odl-dluxapps-topology
opendaylight-user@root>odl-dluxapps-yangui
opendaylight-user@root>odl-dluxapps-yangvisualizer
opendaylight-user@root>odl-dluxapps-yangman

Opensitch-ui

odl-dlux

9. after add all feature needed  by OpenDaylight (ODL) , you can check port listening of your ODL system with command :

#netstat -an | grep tcp

make sure you can see port TCP:8181 as port service to access web interface OpenDaylight, TCP:6633 and TCP:6653 (Port Service Communication for OpenFlow)

 d. Access OpenDaylight Platform

To Access OpenDaylight Platform as SDN Controller type on your URL browser

<IP address OpenDaylight>:8181/index.html

ex : 192.168.98.211:8181/index.html (dont forget type till the path index.html)

image2015-9-13-16_41_14

login to the OpenDaylight controll used default cridential

user : admin

pass : admin

and you will be shown main page of OpenDaylight controller like on the picture below

Default mainweb page

e. Integrate OpenDaylight to Mininet as SDN Controller

at this stage we have success to run OpenDaylight Platform and access OpenDayligt website interface (DLUX), next step we will integrate our Mininet SDN emulator to OpenDaylight Platform as SDN Controller through Simple topology

  Login to your mininet Virtual Machine, and create simple topology used mininet emulator with  OpenDaylight Platform as Remote Controller SDN with command

root@mininet#sudo mn –topo tree,2 –controller remote,ip=192.168.98.211

Note : 192.168.98.211 is IP address OpenDaylight Platform

from command above, mininet will create 3 OpenVSwitch, 4 host and 1 Remote Controller. after execute that command, we can back to web interface opendaylight to see topology information from mininet. click 3 Bar near logout button on top right corner and choose topology like example picture below

yang man

and we can see topology on mininet configuration from command execution before

Topology

from execution command before, we know mininet will created 3 OVS and 4 host on network emulator, but on topology OpenDaylight controller, we just see 3 OVS and can not find 4 host connected to OVS, this happen because OVS need obtaining the MAC address to identifying host conencted to they interface. So from mininet command line interface do Ping to all host on mininet topology with command

mininet>pingall

back to topology OpenDaylight and click reload button to refresh topology information , now we can see on OpenDaylight Topology there 4 hosts connected to OpenVSwitch like on the picture below

Host conencted

That’s all i can share to you on this article, hope this informative for you and thank you


Learning SDN (Software Defined Networking) Concept with Mininet

openflow-2

Whats is SDN (Software Defined Networking)? well, thats question will create many opinion and statement from many vendor, website, consultant and other organization, from website opennetworking.org i quote “Software-Defined Networking (SDN) is an emerging architecture that is dynamic, manageable, cost-effective, and adaptable, making it ideal for the high-bandwidth, dynamic nature of today’s applications. This architecture decouples the network control and forwarding functions, enabling the network control to become directly programmable and the underlying infrastructure to be abstracted for applications and network services. The OpenFlow® protocol is a foundational element for building SDN solutions.”

Whats is the goal of SDN? from sdxcentral.com I was quote “The goal of  Software Defined Networking is to enable cloud and network engineers and administrators to respond quickly to changing business requirements via a centralized control console”

From my own opinion, SDN is a way how we (Network Admin or Engineer) facing the speed of bussines development especially in digital bussines that used software application or software service as a core bussines to their customer or marketplace, this bussines model usually have rapid growing bussines, dynamic, and need fast improvement with new innovation to their product, because on this digital era this model business it’s so promises, and the competition its very tight, software was developed everyday, every device connected to the internet, innovation was come and produce as a software product to solve human problem, make bussines requirement growing fast and pushing traditional networks to the limit ,in addition how we manage network look so slow.

SDN Benefit??

  • Directly Prorgrammable : enables the network to be programmatically configured by proprietary or open source automation tools, including OpenStack, Puppet, Ansible, Python Script and  Chef (yes all about automation and agile)
  • Reduce Opex : yes, because with directly programmable, we can automate provisioning, configuration, and orchrestation
  • Agility : Sure, Abstracting control from forwarding lets administrators dynamically adjust network-wide traffic flow to meet changing needs, (we can totally control the flow)
  • Centrally managed : its make we easier to management our network infrastructure then we must remote node by node and do manual config

SDN Architecture??

SDN-Framework1

Like on the picture above, Commonly SDN Architecture have 3 Layer:

1. Application Layer

On this layer there Northbound APIs: Software-Defined Networking uses northbound APIs to communicates with the applications and business logic “above.” These help network administrators to programmatically shape traffic and deploy services.

On the application layer, it can be orchestrator system infrastructure ,automation tools, Or Python Script

 2. Controll Layer

This layer is “brains” of the network, SDN Controllers offer a centralized view of the overall network, and enable network administrators to dictate to the underlying systems (like switches and routers) how the forwarding plane should handle network traffic.

 3. Infrastructure Layer

on infrastructure layer there Southbound APIs: Software-defined networking uses southbound APIs to relay information to the switches and routers “below.” OpenFlow, considered the first standard in SDN, was the original southbound API and remains as one of the most common protocols.

On this article we will do some lab environment to know more aboute concept of Software defined network used “Mininet”, what is mininet?? Mininet is a network emulator which creates a network of virtual hosts, switches, controllers, and links. Mininet hosts run standard Linux network software, and its switches support OpenFlow for highly flexible custom routing and Software-Defined Networking. To know more information you can visit their website on http://mininet.org/overview/.

On this experiment I installed mininet on my linux Ubuntu 14.04 64 Bit, this installation is quietly easy, I used 2 Core, 40 Gb disk and 4 Gb RAM on my Virtualization. Actually you can just download the virtual edition on their website

https://github.com/mininet/mininet/wiki/Mininet-VM-Images

http://mininet.org/download/

but sometimes too easy make you lazy (lol) so I choose installed the mininet manually to my linux Ubuntu system

How to install Mininet??

To Install mininet on your linux system used command:

#sudo apt-get update

# sudo apt-get install mininet

apt

Do clean instalation of mininet with command

# sudo mn -c

Install Git to download mininet from Git source code management

# sudo apt-get install git

Download Mininet Dependency from git Source code management

#git clone git://github.com/mininet/mininet

clone Mininet

mininet package

Change to directory mininet

#cd mininet

Tag release point of mininet with command

#git tag

git tag

choose package release you want to install, i choose latest release

#git checkout -b cs244-spring-2012-final

install mininet

#/mininet/util/install.sh –a

Install mininet

installation may take a few minutes, because they will donwload all dependency package from internet repository, and when it done ,will show like on the picture below

mininet installed done

Well done, you success install the mininet to your system, easy right,,so dont be lazy la… 😛

Now run the mininet emulator with command

#sudo mn

start mininet

when we start mininet emulator automaticly mininet will give you a topology with 2 Host, one SDN controller, and one OpenvSwitch, then we will see the mininet command line “mininet>”  act like terminal on SDN controller to show and configure all of node in the mininet topology, to know basic command on mininet terminal we can do help comamnd “mininet>help”

mininet console help

because this is command line base, maybe its hard to we understand how our topology looks like, so we can used some command to figure out mininet topology and understand how they connected

To see topology connection used command

Mininet>net

To see Node available on topology used command

Mininet>nodes

To see links available to interconnect all nodes on topology mininet used command

Mininet>links

To test ping host on default mininet topology you can used command

mininet>pingall

ping all

or to be specific

mininet>h1 ping h2

test Ping sample

to create topology network on mininet used template you cand used command

local controller : #sudo mn –topo tree,2

remote controller : #sudo mn –topo tree,2 –controller remote,ip=<ip remote controller>

create topo

it will automaticly give you a topology network with all link, switch, nodes, and SDN controller

actually you dont worry about this command line interface, maybe you have phobia with command line interface and totally not prever used command line interface to see link connection or your topology network, mininet can integrated with other platform like OpenDaylight to act as remote controller SDN and as web base graphical interface to generate your topologi SDN network into topologi network picture, but actually mininet self have “miniedit”, thats tools will help you to design your network topologi based on topologi network picture, to open miniedit you can used comamnd

Miniedit

and you will shown GUI to design your topologi network like on the picture below

Main

to design your topologi, its pretty simple, you just click  component available on the left corner such Switch, Router, Controller, Link, host and click it to white  page, then i try to create simple design of my network topology like on the picture below

Miniedit topt

you can save your topology into mininet file with format “.mn” or generate that topology into python script through menu file –> l2 Script

next, how we can start it, and how we controll and configuration our node on thats topologi, well like i said to you before mininet used “mininet terminal” to do configuration on all nodes on topology, to show configuration, and do test connection of all node, to start mininet command line after we used miniedit, first we go to menu edit –> preferences, and do enable checklist on checkbox “Start CLI” like on the picture below

preferencess start cli

click OK and click Run button to start your emolator, then go to your terminal linux where you start miniedit, and you will see mininet terminal was available to you do some configuration on your node in the topology network

miniedit cli

because this is simple topology and all network connected through L2, network on both of host is one segment and we have attached controller to both of OpenvSwitch, we will able do ping h1 to h2 with command “pingall” or “h1 ping h2”

Testping topo miniedit

Note : one thing was i get from this miniedit example is, when i created a network topology, example like on the topology miniedit before with 2 switch, two host with same connection network, but without controller connected to both of switch, i cant do test connection ping h1 to h2 and vise versa, either when i changed used one switch and 2 of host connected on one switch, the result of ping test on h1 to h2 is always timeout, then i realize, well, this is the SDN Concept, on legacy network it should be work, but in the SDN environment, even its was a switch, h1 that couldn’t be connect to h2 through a L2 device when that device not connected to the controller

Next, we will do what SDN should be can do, what is that?? yes, we will do some automation on our SDN environment, we will do direct programming to the controller through their API from application layer then controller will generate the configuration and pushed that configuration through OpenFlow to  Infrastrcuture Layer, and on this test i will used python script on application layer to defined my network infrastructure

Lets create script used Python ptogramming, why python? because its simple, its multiplatform, its powerfull to do that, and why u ask? find by tourself, learn, because this program language will be popular to automate your infrastructure (Infrastructure as Code) yo know (lol)

Create Code with Vim editor

#vim sample.py

1

2

3

4

from code above i will create simple network case inter-VLAN with topology like on the picture below

minilab

save that python script and change code file to execute permission with command

#chmod 777 sample.py

and execute code program python to defined your network infrastructure with command

#python sample.py

Python sample

well, with execute that python code program, we have create Inter-VLAN network infrastructure with one router, one switch, 2 VLAN, and 2 Host, thats pretty simple right?

yeah its will help us, it will simplify your work, make your network more agile, efficient, and its technology pretty good enough. so next we will check  node connection from network environment we just created used python script

check nodes we created

nodes sample

check the network connection topology

net sample

Check the network interface address of host “h1”

h1 if

host “h1” gateway

h1 route

Check the network interface address of host “h2”

h2 if

host “h2” gateway

h2 route

Check Interface “h3” Switch

h3 if1

h3 if 2

check VLAN of “h3″switch used command

mininet>h3 brctl show

Check “h4” router interface

h4 if

And the last thing, lets we do test ping connection from host “h1” to host “h2” through inter-VLAN network

from host “h1” to host “h2”

test Ping sample

from host “h2” to host “h1”

h2 ping h2

Well, done….hope this article can help you and thanks for read my article


Ntopng for flow collector and traffic analysis

ntop

Hi , on this article i will explore about traffic analysis and flow collector, this is so important i think because on this cultulre of technology right now, visibility of your traffic network its very important, because from that visibility we can analysis performance of your network and status flow of your application, with SNMP we can know how performance throughput from each interface network device on your network infrastructure, with flow collector we will know what exactly flow packet traverse through of our network  interface device .

one of flow collector free to capture flow packet on your network infrastructure is “ntop/ntopng” this application can capture flow packet on your network device used two industry standard for flow-based traffic Monitoring “NetFlow” by Cisco and ” Open standard “sFlow”, thats what i know. okay without too much explanation where you can visit their website by yourself lets we installed ntop/ntopng on my linux server and try to capture flow packet from cisco network device for example

a. Install ntopng

Requirement :

  • I used Ubuntu 14.04 64 Bit
  • RAM 2 Gb
  • 1 Core (VM)
  • Disk 30Gb

Step to installation :

  1. Get repository ntop debian package

#wget http://packages.ntop.org/apt-stable/14.04/all/apt-ntop-stable.deb

2. install debian repository to ubuntu system

#dpkg -i apt-ntop-stable.deb

3. Do clean installation

#apt-get clean all

4. do update repository to get any dependency ntop-ng package installation

#apt-get update

5. Install package ntopng with command

#apt-get -y install pfring nprobe ntopng ntopng-data n2disk nbox

After Installation :

1. After installation done create configuration ntopng with command

#vim /etc/ntopng/ntopng.conf

2. And write line configuration like on the example below, then save

NTOPNG.CONF

3. Create empty file to auto start NTOP :

# touch /etc/ntopng/ntopng.start

# ntopng start

4. Start service ntop-ng services with command :

# service ntopng start

5. Check status service (Ntop used Port 3000)

Service Port UP

6. Access with web browser to IP address server ntop used port 3000

http://<IP Ntopng>:3000

7. login with default user and password

user : admin

pass: admin

5

change the default password

6

and the picture below is dashboard admin page ntopng flow collector

7

At the first time we already can see flow traffic on local network, its that segment local network ntopng server in this example network segment ntopng flow collector  is 192.168.20.0/24  IP address ntop-ng server is 192.168.20.7 with gateway is 192.168.20.1

If we are want to see active flow on all address (local and remote) you can choose menu bar Flows, like example picture below

8

on example picture above ntopng can see local network flow packet, the mostly is http packet to port 3000, its that packet flow from my computer to access ntopng with protocol http used port 3000, next i will create simple network topology there is a one sample server attached to router device, on that scenario i will capture flow packet through interface router direct attached to the server and see on ntopng, flow packet ingress and egress to that server through router interface

example topology :

15

on this lab, i used GNS3 network simulator integrate to my vmware workstation and used one cisco router with l2 capability, on this scenario ID ubuntu64-bit-1 is the host running ntopng flow collector, host Ubuntu14-1 is the sample server running some service and as target server we will monitor using ntopng, target server network segment is 192.168.1.0/24, IP Target server is 192.168.1.10. R1 is network device router that will activate Netflow on the interface attached to target server and send the flow capture to ntopng.

1. Configure and activate Netflow protocol on cisco router to interface direct attached to target server

===========================================================

config#ip flow-cache timeout active 1

config#ip flow-export source FastEthernet0/1<Interface you want to eneble capture>

config#ip flow-export version 9

config#ip flow-export <destination your-ntopng ip-address> 2055

configure On the interface you want enable flow capturing so as to send it to ntopng. This example illustrate using fastEthernet0/1

config# interface FastEthernet0/1

config-if# ip flow ingress

config-if# ip flow egress

=======================================================

next we will test send some packet to server target (ubuntu14-1) to capture flow packet to that server and get the visibility on ntop-ng, we will send packet flow from ntop-ng server Ubuntu64 to target server Ubuntu14 used three type connection : ICMP, SSH, and HTTP

14


Then we back to window ntop-ng and choose menu hosts to see IP address of target server is have flow connection or not, and like on the picture below ntop-ng was discover IP target server 192.168.1.10 is already have 3 flow connection,

9

to see detailed flow connection click the IP address of target server “192.168.1.10”

10

If we choose manu bar Traffic, we can see live flow traffic protocol to the target server , like on the picture below target server accept connection ICMP and TCP

11

If we want to know presentage protocol flow on target server we can choose menu Protocols

12

If we want to know detail flow of packet to target server we can choose menu “Flows”

13

Thats all a little information i can share to you, hope this article usefull and thank you for Visit my Blog

Python Scripting For Network Engineer (Paramiko Part2)

python-logo-master-v3-TM

Hi,

Welcome to my article about  Python Scripting for Administration and Automation Management Network Device used Paramiko Part 2, in previous section i was introduce to you about what is python paramiko, and what we can do used paramiko in our infrastructure operation.

oke i help you to remember, Paramiko is python interface around SSH networking, this method was used on Ansible as Configuration management, remote execution, automation deployment, to your system and IT infrastructure without agent installation on your system (Agentless). so in this article i used paramiko with a little bit python scripting to create simply tools application and used that tools to remote my network device or system to get information  what i need used remote execute command. to do configuration task, i will show you on next section.

i was show to you from previous section (Paramiko-Part1) how to install and used python-paramiko to execute script and create remote session to remote device, so i assumed you have understand and i can continue to python script and explanation.

create python script on your linux system (i used Ubuntu 14.04 LTS) with command

#vim paramiko-show.py

i will separate script and give the explanation

Banner

#Noted : on this part i declare and import module paramiko to python script so i can called that module when i execute my script

Banner 2

#Noted : This is Banner my application tools (its funny right..LuL)

Remote inizialisation


# Noted : this pieces  is code initialization i create remote connection from my terminal, do sleep session in one second “time.sleep(1)” till remote session created done and save output remote session to variable  named “output”

Ping

#Noted : This Script is python while loop to check are host destination we want to remote is on UP or Down Condition, user will input Address destination host which will remote and save the value on variable “ip”, and do command “ping -c 1” to ip destination (ping at once count) used “module os” i have import at top and save the value to variable response. next i do python if and else condition in python while loop function, if the value variable “response”  while loop  is Zero (Success) print command in terminal “Destination is UP” while loop will be end “False” and execution will continue to next script, if the value “response” other than Zero, print command “Destination is Down” and looping will be happend and ask user to input destination host

Login Username Session

#Noted : on this piece code i used raw_input string to get value from user, and save the input to variable username for username user, and password to password input from user, i used getpass portable password input to hide value password user when they write it on terminal.

on the second piece script i do python paramiko function to called SSH client and do remote connection used value on variable “ip, username, and password”, then when connection success terminal will print info “you are login sir”, show result remote session and clear terminal when its done

Menu and If condition 1

Note : in this piece code i do python while loop again to choose menu section after we success login to system the remote host, this menu is option to get information or status from your remote host/device, on this example i  created  remote command to get information from my palo alto firewall like Interface status, route table and software information through choose option.

user will give they inpute choose on integer value and we will save that value on variable “cfchoose“, then from that input user value on variable cfchoose we will create if else condition on python while loop choose menu section.

if user give the integer input number 1 which that mean want to know interface status palo alto device, paramiko will send remote command palo alto “show interface hardware” to get information interface status  of palo alto device, do time sleep on 2 second till all the output success shown, then save that result on variable “output” and print it to our terminal. do time sleep on 10 second till user done to see and capture the result then do clear terminal and looping back to choose menu option

Menu and If condition 2

Note : in the example script above, if user choose option number 2 which mean user want to show routing table in this terminal from remote palo alto device, paramiko will send remote command palo alto to show the route table that firewall device with comamnd “show routing route”, do sleep time till all output from remote command shown and save the value to variable output, then show that result to the terminal. next do time sleep on 10 second so user can see and capture the result, before we clear terminal output and looping back to choose menu options

Next section if user choose option number 3 which mean want to know OS version of palo alto firewall device, paramiko will send remote command to palo alto via SSH to get system information used command “show ystem info”, this command will show to you about all system information of palo alto device, like hostname, SN, OS version, Wildfire and many more, but in this case we just want get specific information from that all value we can get from system information, i just want to know the OS version so in this case i used another method from 2 script cfchoose section we have seen before, after do remote command to palo alto, i save the value to variable output, then i do for loop python on section if else cfchoose, i will loop all value i have save on variable output and put it on variable  line  and do if condition againts, if on this loop i get  ‘sw-version’ i will put that value on variable line and show it to the terminal, next do time sleep on 10 second so user can see and capture the result, before we clear terminal output and looping back to choose menu options

Menu and If condition 3 and negative condition

Note :  if user choose option number 4 which mean  user want to exit from this application, script will stop python while loop  for choose menu option, close remote session SSH to remote host/device and print information “thank you for used this tools”

and the last is “else” the negative condition, it will show when input user on while loop choose menu option is not valid, it will print info “Your input is not valid, try again” then do looping back to input user on choose menu option

In the picture below i show to you how this application is working :

First

picture above is section when i run the python script, input address remote host/device and login used my cridential to palo alto device

Two

after we success login, we will see choose option menu, to choose what we will do from their option menu

three

picture above is example if we choose option one which mean, want to know interface status of palo alto firewall

Thress

picture above is example if we choose option 2 which mean show route table of palo alto device

four

picture above is example if we choose option 3 which mean show OS Version palo alto device from system information value

five

picture above is example if we choose option 4 which mean want to out from this application

Full Script

All script

Okay , thats all i can share to you on this article, on the next section we will try to create application configuration for network device used python paramiko scripting

Thanks


Python Scripting For Network Engineer (Paramiko) Part-1

python-logo-master-v3-TM

Wake up on 5.00 AM GMT+7, i start thinking what should i do on this morning, better im playing Dota 2 😛 or Write Some article. and my heart say something sh*t like, used your time for something useful and be a good person with helping each other.

This article is my promise to you from previous article,when im talking about ansible, i was promise to you i will create a new session about what is paramiko? And example scripting used paramiko phyton to manage your network device

1. What is paramiko :

Paramiko is a Python (2.6+, 3.3+) implementation of the SSHv2 protocol [1], providing both client and server functionality. While it leverages a Python C extension for low level cryptography (Cryptography), Paramiko itself is a pure Python interface around SSH networking concepts.

  • Paramiko is python interface around SSH networking
  • I will used it connect to Network Device or Linux System
  • After Create Connection you can execute any task with python script or run other bash script on linux system
  • More Information you can get at http://www.paramiko.org

2. How to install paramiko phyton

In this article i still used ubuntu 14.04 LTS to run my python script, on default ubuntu dont have paramiko phyton module on that system, we can check used python interface from linux terminal

Go to phyton interface with command

#python

and try to import module paramiko on python script, like example picture below

> import paramiko

Import paramiko

So we will install module paramiko python first to ubuntu system with command

#sudo apt-get update

#sudo apt-get install python-paramiko

On the picture above we can see, import module was error “ImportError : No module named paramiko”

Install paramiko

After we success installed paramiko python on our system, next we try again to import module paramiko again to our python script, its should be success

Import paramiko Succcess

as you can see, we not get error message when we import paramiko on python script

3. Using paramiko on python scripting

Next we will create a simple basic python scripting used python paramiko to do a remote connection to network device, just test remote connection used python paramiko, so you will understand  basic simple scripting using python paramiko. create file python script with command

#vim paramiko-login.py

And create python script like example on the below

============================================================

import paramiko <call module paramiko>
import time
import os
import getpass

terus_tanya = True
while terus_tanya: <<<<<<<<<<<<<<<looping function and conditions>
ip = raw_input(‘Masukkan IP Tujuan:’)
response = os.system(“ping -c 1 ” + ip)

if response == 0:
terus_tanya = False
print “Destination is UP”
else:
terus_tanya = True
print “Destination is Down”

username = raw_input(‘Masukkan Username Anda:’) <input string>
password = getpass.getpass(“Password: “) <save password used module getpass>
port = 22

/*Noted : on this script i used function raw_input phyton to make user give input value and save the value to username variable, because i dont want to defined  username and showed the usename value on this script and used getpass function to password cridential, because i dont want when user input they password it will showed on command prompt*/

remote = paramiko.SSHClient()
remote.set_missing_host_key_policy(paramiko.AutoAddPolicy())
remote.connect(ip, username=username, password=password, look_for_keys=False, allow_agent=False)
print “you are login Sir”

/*above is script to called SSH function and do login session with SSH protocol*/


===============================================================

Script one right

Save python script login parramiko to a file

4. give grant permission on ubuntu system to execute that python script with command

#sudo chmod 111

Permission file

And check file permission with command

#ll or ls -l

Paramiko permission status

5. Now we can execute the python script with command

#python paramiko.py

on this i will do a remote session used python paramiko script from my ubuntu system on IP 192.168.98.155 to Security Device Palo Alto on IP 192.168.98.51 through SSH protocol, the result i show to you on the example picture below

Test Script

Example picture above show we success execute python scripting and success login to security device palo alto on ip 192.168.98.51

To make sure our python script success We must check on Palo Alto dashboard log system to get information IP ubuntu system ex (192.168.98.155) have success create SSH connection to palo alto and success do auhtentication admin

authentication paramiko on dashboard palio

From picture above its look like we success login to palo alto device used python paramiko. and this is a end of session article Python Paramiko Part 1

next section, we will create python script to get information on device after we success login to their system with paramiko python scripting, try to configure device, and many more, the last we will create simple application tools to manage our network device via paramiko python scripting

hope you enjoyed it, Thanks


(Squid) forward Proxy for Internet Access Control and Visibility


squid_proxy_logo

Hi all,

Have you ever get problem about bandwidth on your office always get exhausted, even upgrade the capacity your internet link bandwidth its not solution to solve your problem, and your boss start asking  you, what happend to our internet? why its so slow even we increase the bandwith capacity, can you show  internet access information  from this office to internet, i wanna know what they access to the internet on office hour and what type of traffic access have consume our bandwidth ? what you will answer to your boss??

One of solution to answer your problem is to put forward proxy to controll user access to internet website used Access List from URL list address and log the information website access  to analyze what next policy should be implement to controll internet access and generate report to your boss about visibility what their access, who access that website, and when.

on this article i used one of legend  proxy server to control user website access to the internet, its open source and free,… yes the name is Squid proxy. are squid have another feature except Internet Access Control?? Suree….. you can check squid feature on their website https://wiki.squid-cache.org/Features but on this article i wanna used squid as Internet Access Control and management, with visibility information about what website they already access, who access the website, when they access that website.

On vendor product appliance we know “ProxySG” with feature WebFilter from BlueCoat System, or Sangfor (IAM)  Internet Access Management have similar function like SQUID Proxy.

First we will installed squid proxy on Linux Ubuntu System 14.04 LTS 64 bit.

a. Installation

do update repository your Ubuntu System

#sudo apt-get update

install squid 3 to the system

# sudo apt-get install squid

1

Squid Version

check squid instalation and service status

#sudo service squid3 status

#netsat -an | grep tcp

netstat -n

default port service squid 3 is 3128

location directory configuration squid3 is /etc/squid3

file on squid

location directory log access  Squid3 is /var/log/squid3/


On this step, you already install squid3  proxy to your ubuntu system

b. Configuration SQUID

for safety configuration do copy original file configuration squid to your home directory
#sudo cp /etc/squid3/squid.conf /home/lhutapea/squid.conf.bak

change listener service default proxy (3128) to new service (ex)8181
edit file squid.conf with command

#vim /etc/squid3/squid.conf

change line below :

http_port 3128
to
http_port 8181

change port service

restart squid3 service to get effect new configuration with command

#sudo service squid3 restart

check status squid service with command

#sudo service squid3 status

Status Squid

that service proxy have been change to port 8181

after change service

Configure user  browser to used squid proxy server, for example on the Mozilla Firefox you can setting proxy from menu options –> Advanced –> Network –> Settings and do configuration like on the picture below

Proxy Sett browser

on this step when we seting our client computer to used squid proxy on the browser, that computer will unable access website on internet, this is because default policy  squid proxy configuration is deny all connection http access, so the first thing is we must defined policy access list (ACL) to allow our user access to the internet website based on specific criteria.

Deny All

1. acl base on network segment

on first example we will allow client to able  do http access when the user used IP segment 172.20.10.0/28

create acl on squid configuration and allow ip network 172.20.10.0/28 can do http access like example on the picture below

#sudo vim /etc/squid3/squid.conf

Allow Network

restart squid service to get effect change configuration

#sudo service squid3 restart

and test your http access from your browser, if your client computer used network segment 172.20.10.0/28 you shold be able access website internet, if you cant access website access you can check the log access on directory /var/log/squid3/access.log

#sudo tail -f /var/log/squid3/access.log

2. acl base url domain request

On the second example we will create access list client will be able do http access if their access to the specific website url, for example they will be able access facebook.com and youtube.com, and denied http access to other website url

create acl configuration like on the picture below

Allow Specific Domain

3. acl base on user cridential digest file

On this acl configuration example, we will allow user do http access when he success do proxy login used user credential from digest file, to make squid proxy ask login  credential when user open their browser,  we will do some configuration first

do install apache2-utils to create web authentication proxy access
#sudo apt-get install apache2-utils

set user proxy authentication
#sudo htdigest -c /etc/squid3/passwords realm_name user_name

for example
#sudo htdigest -c /etc/squid3/passwords fachri afachri <Enter>
New password:
Re-type new password:

i have create user fachri to file directory /etc/squid3/passwords with username afachri and enter that password

after we install htdigest next step we will make browser challenge username and password form when we used squid proxy to access internet website,

edit squid configuration  to be configuration line like on the below

#sudo vim /etc/squid3/squid.conf

edit config authentication digest file

that config above will make browser client used squid as proxy will get authentication challenge before they can access website on the internet, if they cant success conection http access will be blocked,

Username and password question

4. ACL Base Authentication Digest File and Regex List Domain File

On this example we will try configuration acl policy user access to internet website base authentication digest file and list allowed domain file, so when user success login to proxy server he will allow do http access only to specific domain name already defined used regex on file list domain.

firts we must create file  with list domain name will allowed access by client after they success login to proxy,

create file allowed_domain.txt on directory /etc/squid3

#vim /etc/squid3/allowed_domain.txt

then create list domain will allowed access by user client used regular expresion like example picture on the below

allow domain regex

on this example i have create list domain name google and galaxidata, is the only domain name will be allowed access by client after they success login to proxy server

next, edit configuration on squid.conf, so that policy can be applied when computer client using squid as proxy server on their browser

edit file squid.conf

#vim /etc/squid3/squid.conf

Regex

then restart your squid proxy service to get configuration effect

#sudo service squid3 restart

test your configuration policy acl on squid proxy, access some website, login to proxy server, then access website google, its must be allowed, then try access another website like apple.com, its should be not allowed

5. Policy acl base authentication Active Directory used LDAP Protocol

On this example we will change authentication method used by proxy with joining this proxy to active directory used LDAP Protocol, actually squid can joined to AD base on Karberos, but i choose LDAP because is common protocol, so you can joined to AD  windows server or LDAP server on linux system

first we  create user credential on active directory and that user will used by squid proxy to join to active directory and able query to directory domain name

1. Create user squidproxy on active directory user and computer on menu

Server Manager >> Tools >> Active Directory Users and Computers,  right click and click New, then create new user like example picture on the below

Squid user step 1

next fill the password

Squid user step 2

next and finish

Squid user step 3

when we succes create new user on Active Directory the new username account will be listed on user directory,

next right click the new user name then click properties

Squid user step 4

on the tab member of  click  add button to joining the new user profile to another group member:

  • Distributed COM
  • Event Log Readers
  • Server Opertor

Squid user step 5

result should be like example picture on the below

Squid user step 6

click Apply and OK

2. Create WMI permission to the user squidproxy through WMI Control

go to search on windows server, and write wmimgmt.msc then enter

you should be shown WMI Controll like example picture on the below,

right click  WMI Control (local) >> properties >> Security explore folder Root

choose folder CIMV2 >> Security

Squid user step 7


click button add and fill username squidproxy to Security for ROOT\CIMV2 like example picture on the below

Squid user step 8

then give grant permission on that user on WMI Control like example picture on below

Squid user step 9

Click Apply and OK to agreed configuration setting on Security WMI Control

3.Edit Squid Configuration and joined Squid to Active Directory Used Protocol LDAP

next step we will edit configuration squid.conf to join squid proxy to active directory used protocol LDAP. edit squid configuration like example on the below

=========================================================================

auth_param basic program /usr/lib/squid3/basic_ldap_auth -b “dc=galaxidata,dc=local” -D cn=squidproxy,cn=Users,dc=galaxidata,dc=local -w squidproxy123 -f “sAMAccountName=%s” -c 2 -t 2 -h 192.168.98.44 (Note: this configuration must be on one line)

auth_param basic children 10
auth_param basic realm pengguna
auth_param basic credentialsttl 1 hours

acl ldapauth proxy_auth REQUIRED
acl boleh dstdom_regex -i “/etc/squid3/allow_domain.txt”
http_access allow ldapauth boleh

=========================================================================

-b = <domain name your AD

-D = <Canonical name user account that squid used join to active directory, example squidproxy>

-w = <password user account squidproxy>

-f = <Used format username sAMAccountName active directory to squid  do a query  to AD server for identified existance of user

-h = <IP address Active Directory>

Config LDAP Auth Squid Must One Line

restart squid proxy service to get effect changing configuration, and test user to login on squid proxy server when access internet website used their AD username and password and when success do testing access to domain name allowed  by squid proxy  based on list allowed_domain.txt and test to website should be denied by squid proxy.

on this step we have success to control internet access of user by policy acl on squid proxy,based on login active directory and allowed only to specific website, actually we can schedule the policy acl too, if you wanna  see information  access website by user you can find it on /var/log/squid3/access.log, example log information access shown on the picture below

Log Access 2

next step we will configure squid proxy can generate that log information accessto be a report  about information who access the website, when, and what the website they access

C. Create Reporting

On this article i will configure squid reporting used SARG (Squid Analysis Report Generatot), this tools will generate access.log squid to be a good report, and we can present to your boss.

1. install SARG on Ubuntu 14.04 used command

#sudo apt-get install sarg

SARG Version

2. we need install apache2 too, so we can access SARG from our browser

#sudo apt-get install apache2

after installation success we will edit configuration of SARG, do step configuration below to integrated SARG to squid proxy

3. Edit SARG configuration

edit SARG configuration file with command

#sudo vim /etc/sarg/sarg.conf

and change default value SARG configuration to  the new one

change access_log directory path value to be:

Config SARG1

Change Output directory path value to be:

SARG Output

Change Date format to Europe Format DDMMYY

Date SARG

Change Graph_font path directory to be:

Font SArg

4. Start SARG to load new configuration setting with command

#sudo sarg -x

Succes Start

5. Access SARG used your browser with url address http://<IP Proxy Server>/squid-reports

and you will see example report generated from access.log proxy like exapmle picture on the below

SARG testing

on the example image above we can see top list user consumed bandwith on period 06-09 oct 2017 is  USERID active directory with name dratnasari, click the name USERID dretnasari to see detail list domain website he already access on time period, and the result will shown on the example  picture  below

Dratnasri Access   Thats all i can share to you on this article, good luck


Uptime (Simple Monitoring for Availability Application) on Ubuntu 14.04

uptime-monitor

Hi All,

On this article, i wanna share to you about one of simple application monitoring, to check percentage availability of your application  through uptime monitoring

Uptime is remote monitoring application using Node.js, MongoDB, licensed under MIT license” open source and this is free. uptime monitoring is specified to monitor availability status and uptime your application, not to check CPU performance on your server not to monitoring Source Code performance on your application, or memory consume of your running application on the system

So lets start begin how to install this application, im install this application on my Linux Ubuntu System 14.04 LTS, for minimum requirement i used virtual server with spec

CPU : 2 Core

RAM : 4GB

Disk : 40 GB

================================================

a. Installation step

===============================================

Do update repository ubuntu

#sudo apt-get update

Install VIM text editor (iam usually used VIM as text editor on Linux system) 😛

#sudo apt-get install vim

Install git for download Uptime package from Github Source Code Management (SCM)

#sudo apt-get install git

1

Install Node JS version 10 or Above (java script runtime)

#sudo apt-get install nodejs

#sudo apt-ge instal nodejs-legacy     –> (dependency to start Application Uptime)

3

Check Node JS installation

#nodejs –v

2

Install node (this node will be used when we started uptime application service)

#sudo apt-get install node

4

Install NPM

We will used NPM when install uptime from source code pakcage we downloaded from github to the system ubuntu

#sudo apt-get install npm

Check instalation npm

#npm –v

5

Installed MongoDB

Uptime monitoring will used mogoDB as Database application

Add mongoDB repository to ubuntu system

#sudo apt-key adv –keyserver hkp://keyserver.ubuntu.com:80 –recv 7F0CEB10

#echo “deb http://repo.mongodb.org/apt/ubuntu “$(lsb_release -sc)”/mongodb-org/3.0 multiverse” | sudo tee /etc/apt/sources.list.d/mongodb-org-3.0.list

Update repository with command

#sudo apt-get update

Do instalation with command

#sudo apt-get install mongodb

Check mongoDB status with command

#sudo service mongodb status

8

Check mongodb version with command

#mongod –version

9

Download uptime package from github used git clone tools

#sudo git clone git://github.com/fzaninotto/uptime.git

10

Make sure the package has already clone to your linux directory

#ls

11.PNG

Delete ./node-gyp/ on ROOT directory with command

#rm -rf ~/.node-gyp/

Go to uptime directory and delete node_modules

#cd /uptime

~/uptime#rm -rf node_modules/

Restart the server, because we just delete some file from root directory

#sudo init 6

13

Install uptime monitoring

Go to directory uptime package

#cd uptime/

Install uptime with npm command

/uptime#npm install

14

And the source code will download registry npmjs from https://registry.npmjs.org/

and   put that registry to the uptime application

Note : when installed uptime you will find some error like on the picture below, that error related to the node_modules we have deleted before, so ignore it

err1

err2

==================================================================

B. Configure Uptime Monitoring and Start

========================================================

Start Uptime Application to environment production with command

/uptime#NODE_ENV=production node app

If you find error like on the picture below, this error because we must configure the uptime first to interconnect uptime application to mongoDB,

15

edit file configuration uptime

#cd /uptime/config

~/uptime/config#vim default.yaml

Change line configuration “connectionString: #”

To be :

connectionString: mongodb://localhost/uptime

This mean is, to connecting uptime to mongoDB without authentication

And dont forget to change timezone your linux, because we need correct time when we recognize our application is down, uptime get clock from ubuntu system

Used command to change timezone

#dpgk-reconfigure tzdata

Add TCP Monitoring on Uptime

On default uptime only can monitoring through http, https, UDP, Webpage Test, if we want to add new module and make Uptime can monitoring application application based on TCP port we must following this metod to add feature tcp monitoring on uptime

For safety when we edit this file configuration better we copy the real configuration file to other directory. For example i copy file config to my home directory

# cp uptime/lib/pollers/pollerCollection.js /home/lhutapea/pollerCollection.js.bak

17

Add TCP monitoring with edit file pollerCollection.js

#cd /uptime/lib/pollers/pollerCollection.js

#vim pollerCollection.js

And add this config (+) to the line configuration pollers, so that configuration like on the below


PollerCollection.prototype.addDefaultPollers = function() {
this.add(require(‘./http/httpPoller.js’));
this.add(require(‘./https/httpsPoller.js’));
this.add(require(‘./udp/udpPoller.js’));
this.add(require(‘./webpagetest/webPageTestPoller.js’));
+ this.add(require(‘./tcp/tcpPoller.js’));
};


18

create new directory in the poller uptime diretory folder

#mkdir /uptime/lib/pollers/tcp

and create new file with this script

#vim /uptime/lib/pollers/tcp/tcpPoller.js

================

Script

===========

/**
* Module dependencies
*/
var util = require(‘util’);
var net = require(‘net’);
var url = require(‘url’);
var dns = require(‘dns’); var dgram = require(‘dgram’); var BasePoller =
require(‘../basePoller’);; /**
TCP Poller constructor
*
*/ function TcpPoller(target, timeout, callback) {
this.target = target;
this.timeout = timeout || 1000;
this.callback = callback;
this.isDebugEnabled = true;
this.initialize();
}
util.inherits(TcpPoller, BasePoller); TcpPoller.type = ‘tcp’; TcpPoller.validateTarget =
function(target) {
var reg = new RegExp(‘tcp:\/\/(.*):(\\d{1,5})’);
return reg.test(target);
};
TcpPoller.prototype.initialize = function() {
var poller = this;
var reg = new RegExp(‘tcp:\/\/(.*)’);
if(!reg.test(this.target)) {
console.log(this.target + ‘ does not seem to be a valid TCP URL’);
}
if(typeof(this.target) == ‘string’) {
this.target = url.parse(this.target);
}
this.target.port = this.target.port || 80;
if(net.isIP(this.target.hostname) == 0) {
dns.lookup(this.target.hostname, function(error, address, family) {
if(error) {
poller.debug(“TCP Connection — DNS Lookup Error: ” + error.message);
} else {
poller.target.hostname = address;
}
});
}
};
TcpPoller.prototype.poll = function() {
TcpPoller.super_.prototype.poll.call(this);
var poller = this;
var client = net.connect({port: this.target.port, host: this.target.hostname}, function()
{
poller.timer.stop();
poller.debug(poller.getTime() + “ms – TCP Connection Established”);
client.end();
poller.callback(undefined, poller.getTime());
});
client.setTimeout(this.timeoutReached, this.timeout);
client.on(‘error’, function(err) {
poller.debug(poller.getTime() + “ms – TCP Connection Error: ” + err.message);
client.end();
poller.callback(null, poller.getTime());
});
client.on(‘end’, function() {
poller.debug(poller.getTime() + “ms – TCP Connection End”);
});
};
module.exports = TcpPoller;

==========================================

20

save the configuration and start uptime once again

check mongodb status  with command

#service mongodb status

start the application uptime with command

#cd /uptime

/uptime#NODE_ENV=production node app

If service success started, it must be like picture on the below

21

====================================================

C. Access uptime and create Check your application Uptime

===================================================

Uptime app will start used service 8082, so can access uptime application from your browser with address:

http://ip address uptime:8082

and the first window is like on the picture below

22

create first check monitoring with click word “create your first check”

and you will shown form new checks monitoring to your application, example create check uptime to your application is like picture below

23

on this picture below you will see i create check uptime to website dell com used type http for example

25

i set polling interval each 60 Second, this mean every 60 second uptime will try triger check to dell website, and alert threshold will be generated if on the pooling time i get 2 times timeout ping,  slow threshold my trigger is 1500 milisecond (1,5 Second), if you wanna grouped check application to category, you can tag the profile check, so the check profile will be categorize as a group through tag name

we can check our application used another type except http, we can used https, TCP or UDP, example type available will be shown in the picture below

24

another example i wanna monitoring Google DNS service used type TCP on port DNS 53

like on this picture

26

this is example list check monitoring i have created, we can see profile check  have been created on the menu Checks like on this picture

Check

if we click the profile name of list checks we can see detail of percentage uptime availability of that application, for example i click profile check “Monitoring Dell website” and see application availability percentage and graph like on this picture

Monitor Del Website

uptime have 3 main menus default, First is event

on the event we can see event history uptime status of application monitored by uptime

Events

second is check, on the check we can create and see list of application minitored by uptime, to create new check uptime profile to our application click button “create check”

Check

number three is “Tags” on this menu we can see list of profile check uptime as group tag

TAG

This is all i can share from this topic, hope this will help you

Thanks


Sharing : Basic Configuration Palo Alto Feature (Bahasa)

logo-green

Basic Configuration Common Feature Firewall on Palo Alto

Hello, with me again…LuL 😛

Today i wanna share to you about one of  famous Next Generation enterprise firewall, right now he is leader on the gartner for Enterprise Firewall categories, yes like you see at the picture above, thats name is Palo Alto Firewall. but the question is? what make that’s firewall different from other firewall.

They have Special technology architecture owned by palo alto “Single pass parallel processing (SP3)” which differentiates from its competitors is enabled firewall to work on high throughput and low latency even while incorporating unprecedented features and technology. Next Generation Firewall technology palo alto used 3 main key for visibility and control : App-ID,User-ID and Content-ID, App-ID used to determine the exact identity of applications regardless of port, IP address and protocol, User-ID used to identification username access with integration to active directory (AD) to See who is using the applications on your network, set policy based on users, Perform forensic analysis and generate reports on user activities, the last is identification of advanced threat through Content-ID based single-pass architecture, which is a unique combination of software and hardware that was designed from the ground up to integrate multiple threat prevention technologies (IPS, anti-malware, Command and Control, URL filtering, file and data filtering). The user and application visibility and control of App-ID and User -ID, coupled with the content inspection enabled by Content-ID, empowers IT teams to regain control over application traffic and related content, integrated with WildFire threat intelligence cloud for advanced analysis and prevention engine for highly evasive zero-day exploits and malware.

for your information,  iam not try to impress you and make you buy this firewall to your enterprise, my pupose create this article is to help you, if you have this firewall on your environment infrastructure and how to configure some basic feature palo alto firewall

i get that information from their website, and my experience , but i believe, security its not just about your firewall capability, its about policy, structure, procedure, aware, standards, and many more aspect you must  see when you design a security system

on this article i create a guide book on PDF,  this book is basic guide how to configure common feature  firewall used appliance palo alto , i used Virtual edition PAN OS 7.1.0

you can download image “PA-VM-ESX-7.0.1-u1.ova”   from link below

create free account and download that image

https://mega.nz/#!hFs3CY6S!aMuvQCNQpZ3G2mm8GEYXaOdxvOrjGlp13MBeTD_rI88

Iam really sorry this guide i created used bahasa, but i think people from another country will understand from name of menu and from the picture.

hope you enjoy it 🙂


ELK/Elastic Stack (Powerfull data analytic engine, and Visualization )

eco-logo-bd924bc09d97ac4372a3db189c8f8486

Hi All,

Today i wanna write about one of platform  data analytic engine (elasticsearch) to analysis data and information from dynamic data collection (logstash), then we can visualize and present  that data to the graph and chart (kibana), we can called “ELK stack” and now the name become “Elastic Stack”, why stack?? because its combination three application platform to process a log information into  visualize data (my opinion)

The question is,  how we can process that data to the important information  and present that data to our company,client or customer in the graphic chart through Elastick Stack?

we can send data and information from system or application to ELK system in syslog streaming, then logstash will collect the log information, filter and parsing that log, and give the output to elasticsearch, in the elasticsearch we can analytic that information, filter the most important data that we need through query used elasticsearch engine and present that filter query to  readable data used Kibana on graphic chart form as information data we can present to our user

Now lets action to create Elastic Stack System

we will instal Elastic + Logstash + Kibana on ubuntu system 14.04 LTS

spec minimum requirement to running ELK my recomendation is :

RAM : 8 GB

CPU : 2 Core

Disk : 40 GB

first we need update the ubuntu repository with comamnd

#sudo apt-get update

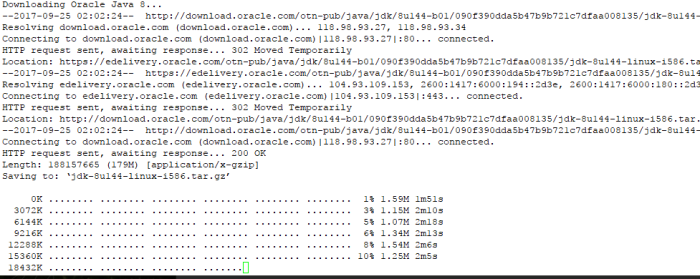
then we will installed Java 8, because Elastic Stack and logstash used java platform

======================================================================================
Install Java version 8
=====================================================================================

a. add oracle PPA repository to ubuntu system

#sudo add-apt-repository -y ppa:webupd8team/java

b. do update package

#apt-get update

c. install java 8 with command

#sudo apt-get -y install oracle-java8-installer


Install Java 8 Output

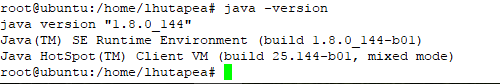
d. check java instalation with

#sudo java -version

Java 8 instalation check

=======================================================================================
Intsall Elasticsearch
===============================================================================================
a. Import public GPG key into apt repository

#wget -qO – https://artifacts.elastic.co/GPG-KEY-elasticsearch | sudo apt-key add –

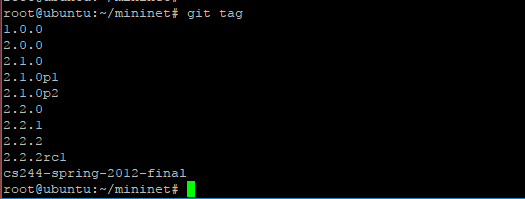
b. Then, you will need to add Elastic’s package source list to apt. (elastic version 5)

#echo “deb https://artifacts.elastic.co/packages/5.x/apt stable main” | sudo tee -a /etc/apt/sources.list.d/elastic-5.x.list

you can check aptitude source list on yur system in /etc/apt/sources.list.d/

c. update repository on your system with command

#sudo apt-get update

v5 success elastic

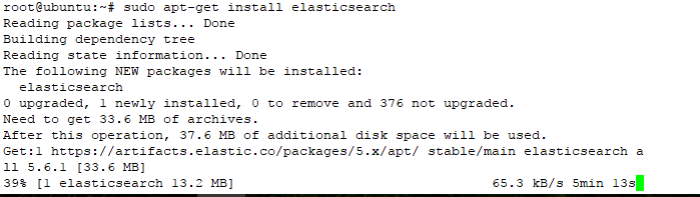
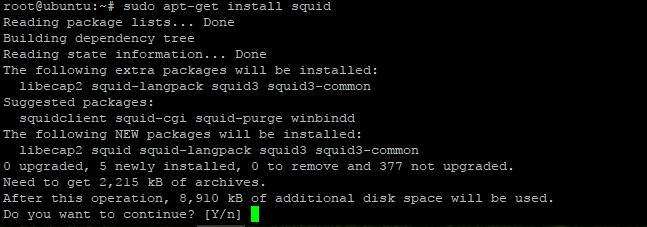
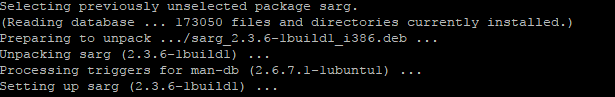
d. install elasticsearch with command

#sudo apt-get install elasticsearch

Install elasticsearch

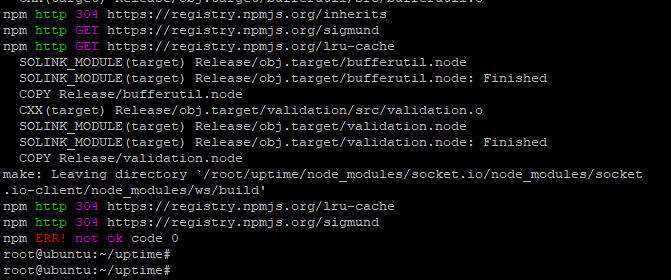
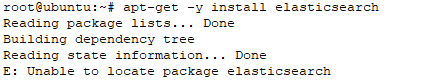
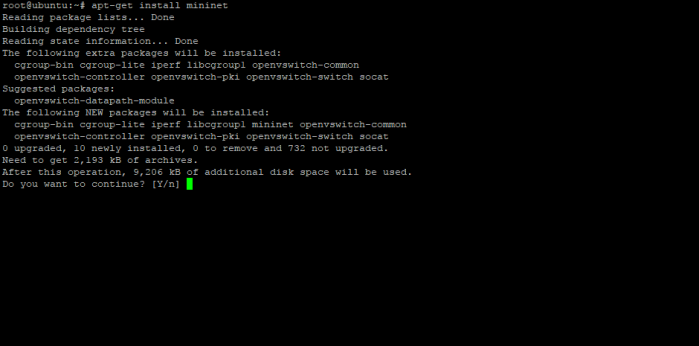
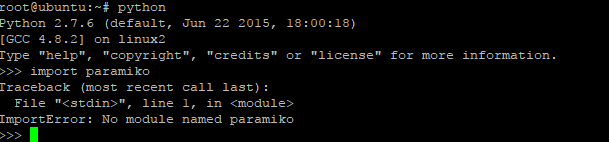
Note : if you refer another source tutorial and they try to install elastic version 2, its not valid anymore, i try used elastic package version 2 , and the result is “unable to locate package elasticsearch”, like on the picuture below

Failde version 2 elastic

Failed Install elastic

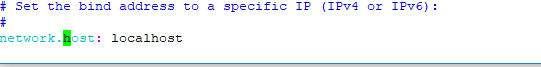
e. Next you will  restrict outside access to your Elasticsearch instance (port 9200), so outsiders can’t read your data or shutdown your Elasticsearch  through the HTTP API.
Find the line that specifies “network.host“, uncomment it, and replace its value with “localhost” so it looks like this:

Let’s edit the configuration on directory /etc/elasticsearch/elasticsearch.yml

#vim /etc/elasticsearch/elasticsearch.yml

uncoment line below and change that value to

network.host: localhost

save file config elasticsearch

Elastic Config

and start elasticsearch service with command

#sudo service elasticsearch start

check status service elasticsearch with comamnd

#sudo service elasticsearch status

f. Next, if we want to start elastic on boot startup used command

#sudo update-rc.d elasticsearch defaults

the output should be like on the picture below

Autostart elasticsearch

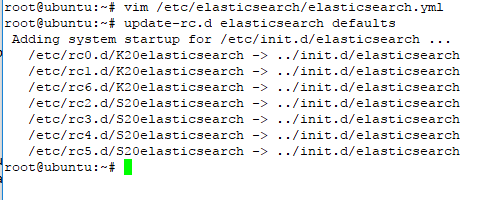
with this command ubuntu system  will be refered directory /etc/init.d/elasticsearch and start all component elasticsearch on the next boot

g. You can test local elasticsearch running with the following curl command:

#curl localhost:9200

the output should be like on the picture below

test accesss local elastic

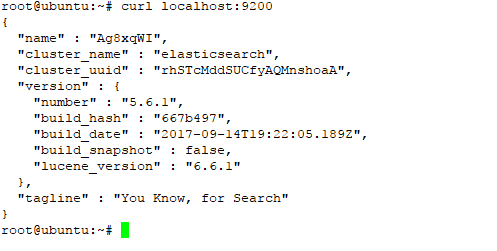
at this step we have success install elasticsearch on ubuntu system

===========================================================================
installing Logstash
===========================================================================

in this step we will install logstash as collection dynamic data and information through streaming syslog, create type input data (ex: UDP: 514) format type data (JSON or syslog), filtering data  and give the output to the elasticsearch

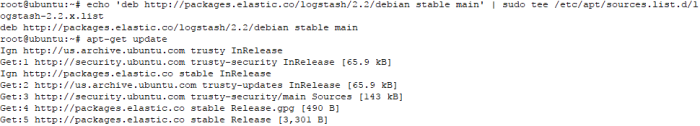
a. to install logstash first add repository logstash to aptitude debian package

#echo ‘deb http://packages.elastic.co/logstash/2.2/debian stable main’ | sudo tee /etc/apt/sources.list.d/logstash-2.2.x.list

b. do update on repository

#sudo apt-get update

Install logstash

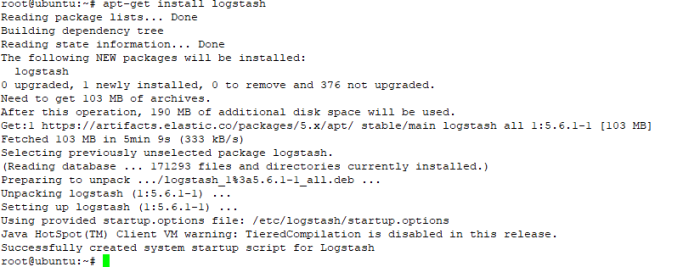
c. install logstash with command

#sudo apt-get install logstash

Install logstash again

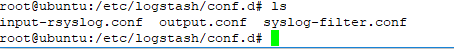
d.After installed logstash dont start that service, we must create logstash configuration first to parsing log they get from remote device about input log setting (port, protocol),format log (syslog,JSON), filter, and output where the output log will be showed, in directory configuration logstash /etc/logstash/conf.d

im split the configuration to three file there is input config , filter config, and output log config

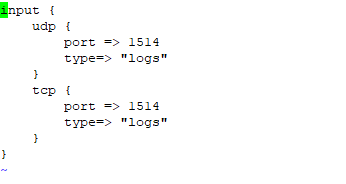
first, create configuration input log  setting, such port service will be used and the type of log streaming.

create configuration with command

#vim /etc/logstash/conf.d/input-rsyslog.conf

and add the line below to the file configuration

===========================
input-rsyslog.conf
=========================
input {
udp {
port => 1514
type=> “logs”
}
tcp {
port => 1514
type=> “logs”
}
}
================================

example picture :

input-syslog conf

second, we will filter log data and make that data to the field information

create configuration file with command

#vim /etc/logstash/conf.d/syslog-filter.conf

add the line on the below to file configuration

===================================
syslog-filter.conf
=====================================
filter {
if [type] == “syslog” {
grok {
match => { “message” => “%{SYSLOGTIMESTAMP:syslog_timestamp} %{SYSLOGHOST:syslog_hostname} %{DATA:syslog_program}(?:[%{POSINT:syslog_pid}])?: %{GREEDYDATA:syslog_message}” }
add_field => [ “received_at”, “%{@timestamp}” ]
add_field => [ “received_from”, “%{host}” ]
}
syslog_pri { }
date {
match => [ “syslog_timestamp”, “MMM d HH:mm:ss”, “MMM dd HH:mm:ss” ]
}
}
}

=================================================================================

the last step, we will create file configuration to put the output log data on elasticsearch

create file configuration with command

#vim /etc/logstash/conf.d/output-syslog.conf

and add the line below to the configuration file

======================================================================
output-syslog.conf
=============================================================
output {
elasticsearch {
hosts => [“localhost:9200”]
}
stdout { codec => rubydebug }
}
=================================================================

this is the most important configuration part when you wanna parsing and filter data from collection data machine and generate log data to be important information you will need to analyze your system, application, security alert, or network device

Logstash config
and this is an example logstash configuration for noob  to parsing log data, 😛

e. if you have create logstash configuration, you can test that configuration with command

#sudo -u logstash /usr/share/logstash/bin/logstash –path.settings /etc/logstash -t

Test config logstash

the result must be “OK” if  the result is not like on the picture there something wrong with your logstash configuration

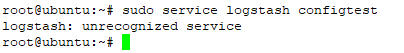
if you used “sudo service logstash configtest” to test configuration logstash

u will get message error because that command not available on this logstash version

test config logstash failed

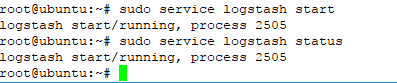
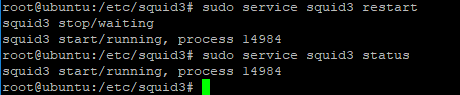
f. start logstash with command
#service logstash start

check logstash status with command

#sudo service logstash status

Logstash start

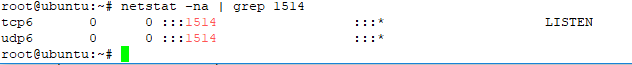
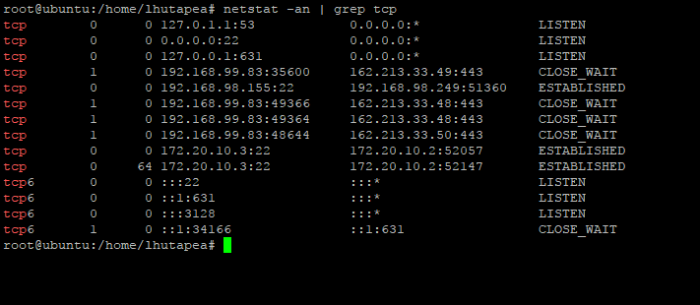
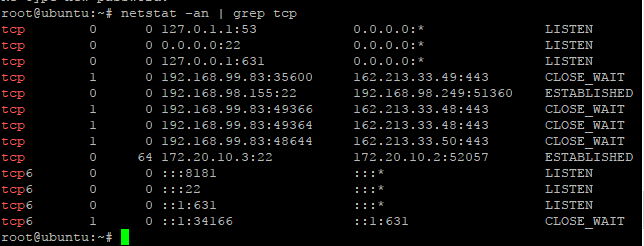
g. check input service port listening  logstash used to collect log streaming from remote device/system/application

on the configuration logstash input, we have defined port service input will be used UDP 1514 and TCP 1514 to collect log data from remote device

check port service to ensure your logstash machine is ready to collect data with command

#netstat -na | grep 1514
#netstat -an | grep udp

listener check logstash

h. for start logstash service on bootup startup ,used command

#sudo initctl start logstash

if you used command below

update-rc.d elasticsearch defaults” its not valid anymore

This is because in new version Logstash automatically detects the startup system of the system in use and deploys the correct startup scripts.

=============================================
install kibana
===========================================

we used kibana to visualize result query log information used elasticsearch from log data collection logstash to present that information to readable graph, chart, count, and pie

a. to install kibana firt we must  add kibana repository to your ubuntu with command
#sudo echo “deb http://packages.elastic.co/kibana/4.4/debian stable main” | sudo tee -a /etc/apt/sources.list.d/kibana-4.4.x.list

b. do update with command
#sudo apt-get update

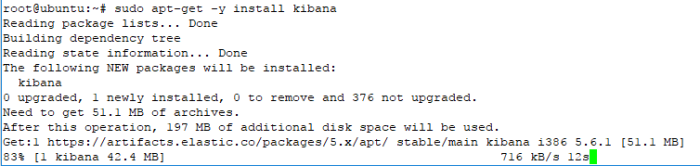
c. install kibana with command
#sudo apt-get -y install kibana

Install kibana

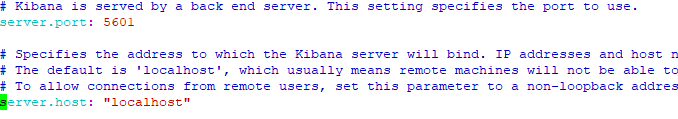
d. after success installed edit konfig kibana yml with command
#sudo vim /etc/kibana/kibana.yml

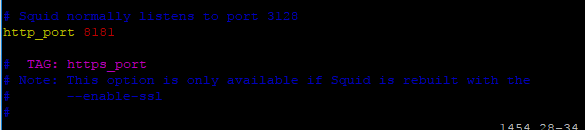
change the specific line to the value like on the below

server.port: 5601
server.host: localhost

Konfig kibana


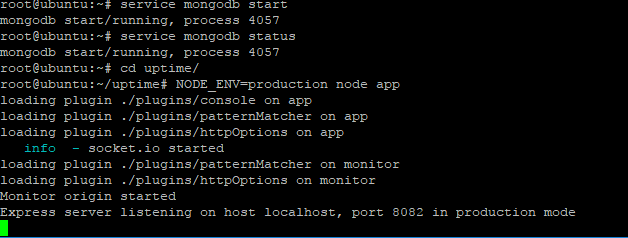
starts kibana with command
#service kibana start

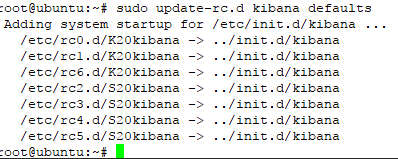
and for configuration start service on  boot startup , used this command

#sudo update-rc.d kibana defaults

kibana autostart

in this step, you have success intalled and configure three main component Elastic Stack (elasticsearch, logstash, and Kibana)

=========================================================
install nginx
====================================================
if we follow the instruction on the above and success, actualy right now we can direct access to eLK through port 5601 kibana, but on this case wee need proxy to masking port service ELK web admin and create login authoriztion username and pasword admin if we want to access ELK web config, so we need NGINX proxy to mapping port and install apache2-utils to create admin cridential login

install Nginx with command

#sudo apt-get install nginx

You will also need to install apache2-utils for htpasswd utility:

#sudo apt-get install apache2-utils

Now, Create admin user to access Kibana web interface using htpasswd utility:

#sudo htpasswd -c /etc/nginx/htpasswd.users admin

Enter password as you wish, you will need this password to access Kibana web interface.

Next, open Nginx default configuration file:

used this comamnd to configure nginx

#sudo vim /etc/nginx/sites-available/default
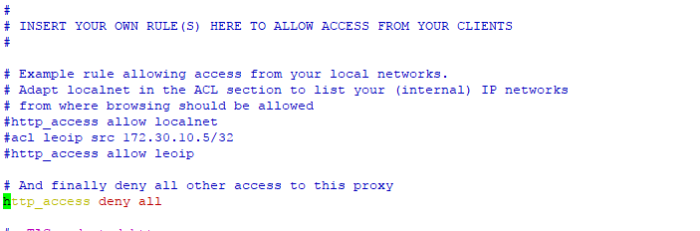
Delete  or comment the all lines and add the following lines:

=================================================
server {
listen 80;
server_name 192.168.1.7;
auth_basic “Restricted Access”;
auth_basic_user_file /etc/nginx/htpasswd.users;
location / {
proxy_pass http://localhost:5601;
proxy_http_version 1.1;
proxy_set_header Upgrade $http_upgrade;
proxy_set_header Connection ‘upgrade’;
proxy_set_header Host $host;
proxy_cache_bypass $http_upgrade;
}
}
============================================================
restart nginx and the result must be OK

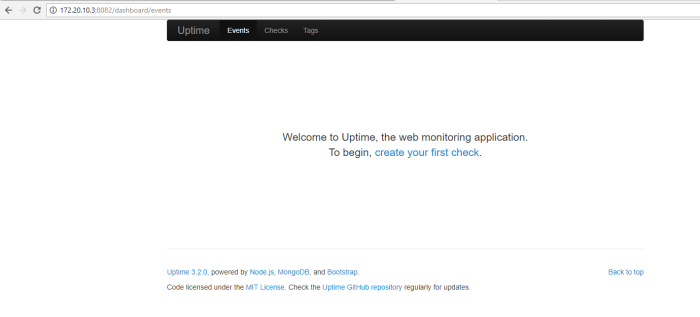
finaly we can access Elastic Stack through ip server http://<ip server>

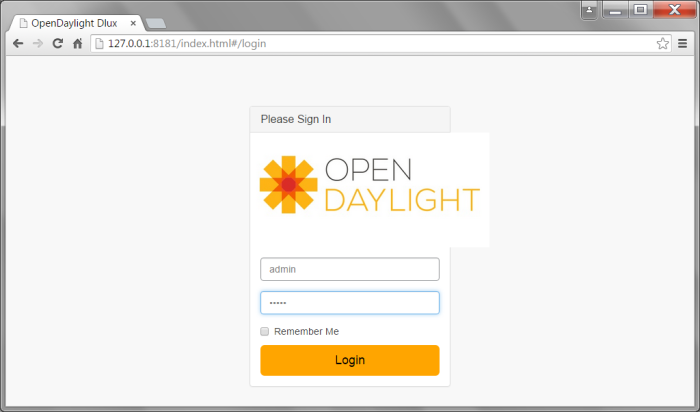
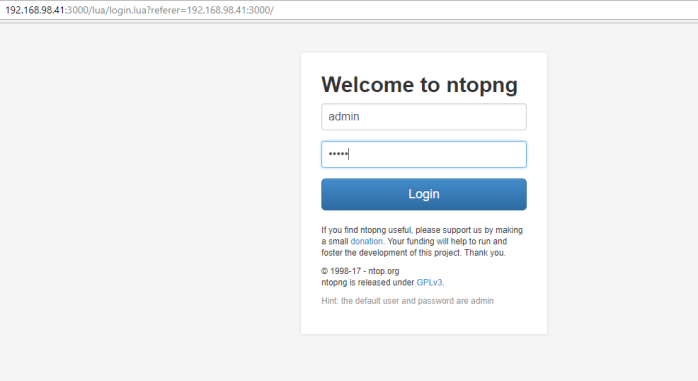
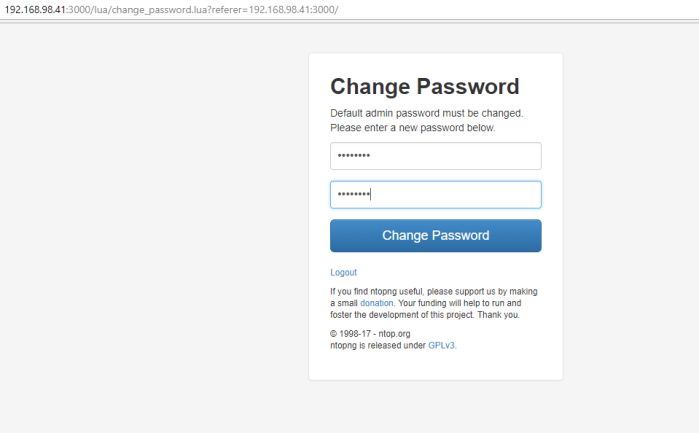
fill credential username and password to access Elastic Stack, if success we will se first window after installation Elastic Stack like on the picture below

Kibana Web

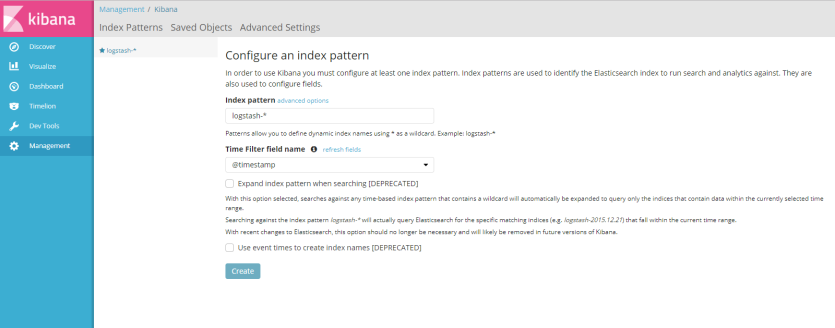
like information said ont the picture above, to used kibana we must configure at least one index patern are used to identify the elasticsearch to run search and analytics againts, and to configure index patern we need sample log file or syslog streaming to Elastic Stack, if you dont have example log data you cant create index pattern

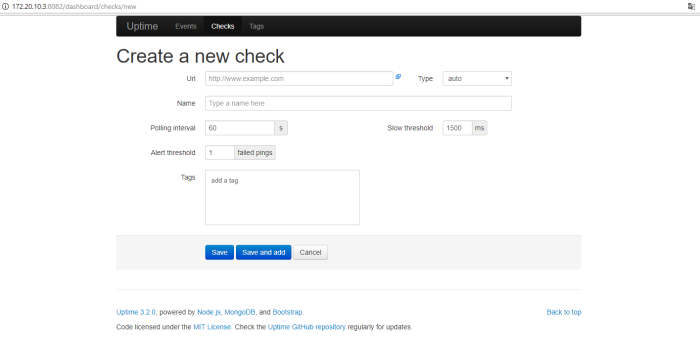
in this example i sent syslog message from my virtual BIG-IP to ELK server, configure BIG-IP to sent syslog message to IP address of Elestic Stack used port 1514 and i success create index patern for Elastic Stack with click button “create”

after create index pattern we will see all syslog message from virtual BIG-IP  on menu “discover”Discover log KIbana

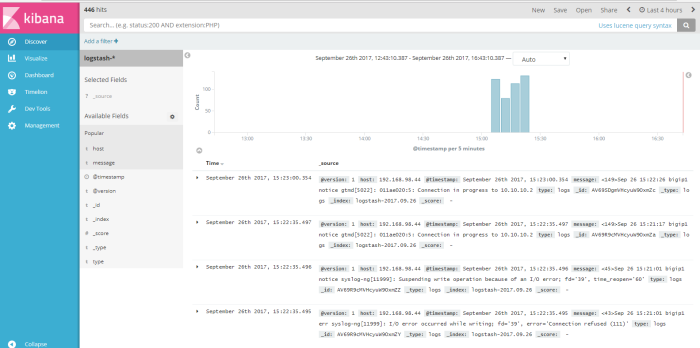
this menu is output data shown from logstash dynamic collection data, from this menu we can do a query search to log data to get information we need to analyze our system or application, we can filter the query search from available field to find a specific information, for example i wanna do a simple query from log data about how many log message send from host 192.168.98.44, so i “add filter” used field “host” logic filter “is” and the value a field host is “192.168.98.44” like on the picture below

save filter kibana

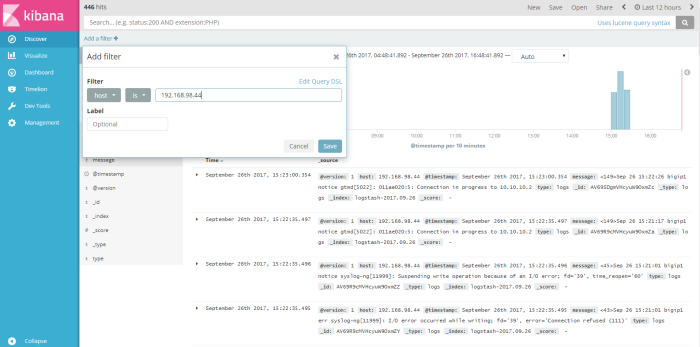
click “save” to save the filter, and the result of our filter will be shown on the picture below

filter kibana 2

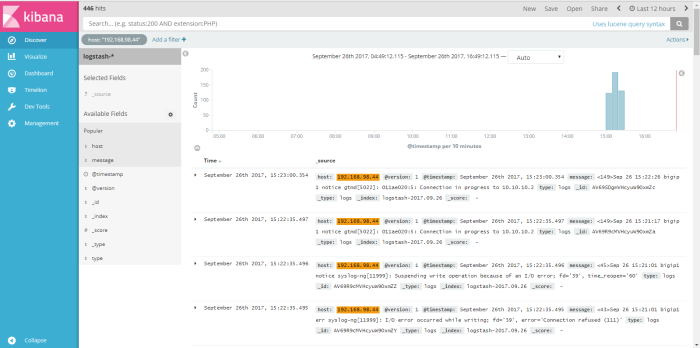
we can save the result filter to a profile name, with click save button on the top right window  and then used that result filter into visual graph through menu “visualize”

on menu visualize we will create new profile like on the picture below

create new visualiz

click button “create new visualization” and choose type visualize will be used to visualize result query information

choose visualize tempalte

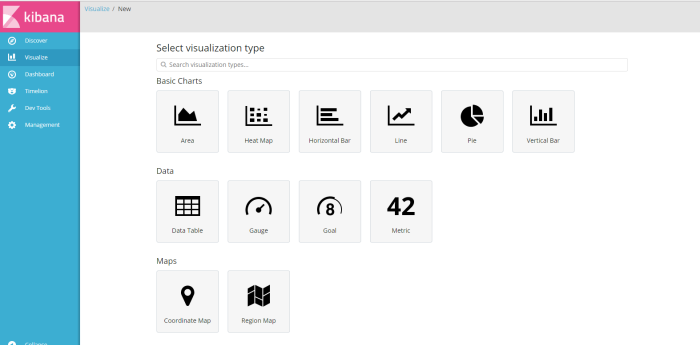
for this example i choose type “vertical bar” charts as visualize result from query filter log profile from menu discover i have created before named “host”, filter information  how many log message  from source host 192.168.98.44 ,

at the second example i will back to menu discover and create new filter to find message how many “connection in progress” we can get on syslog data, add filter and used  “message” as filtering field “is” as logical filter and the value of field message is “connection on progress” and the result shown like on the picture below

Connection in progress save

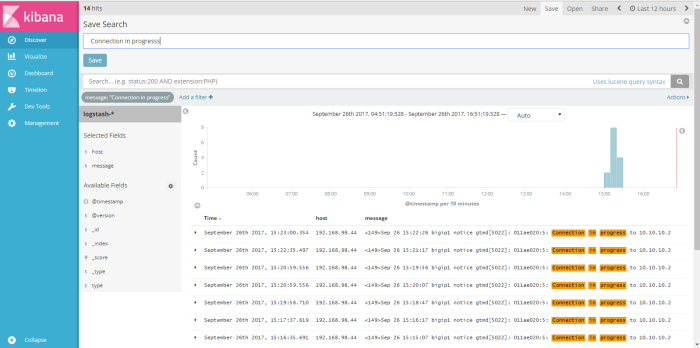
we can save that filter result as profile name, i save search filter with name “connection in porgress, next i will visualize my filter search through menu “visualize”


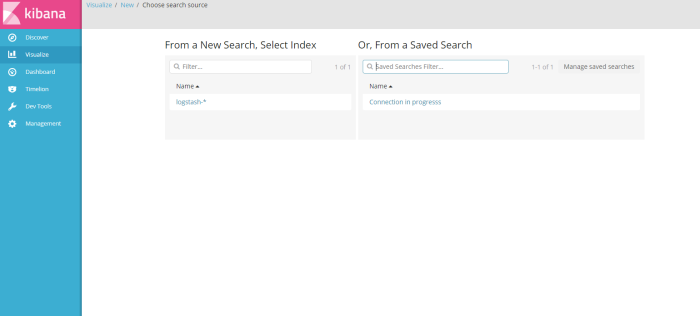
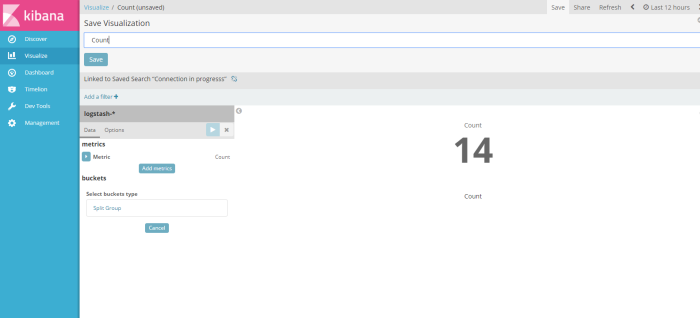
from menu visualize click “create new visualization” for the type of visualize i choose “count”, next i will choose data information source i will visualize, i choose result of search filter from menu discover i have created before “connection in progress” 

Choose from saved search

and the result shown like on the picture below

Save search 2

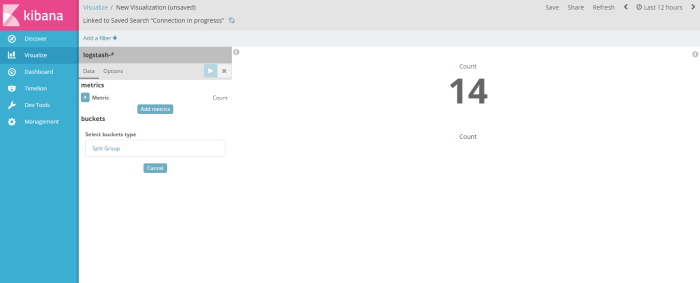
after visualize the result filter dont forget to save that visaulization template to be a profile, in this example i save the visualization profile with name “count”

save count

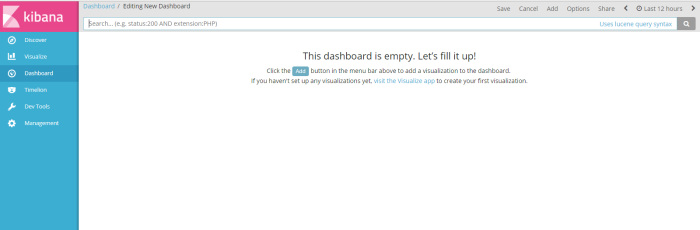
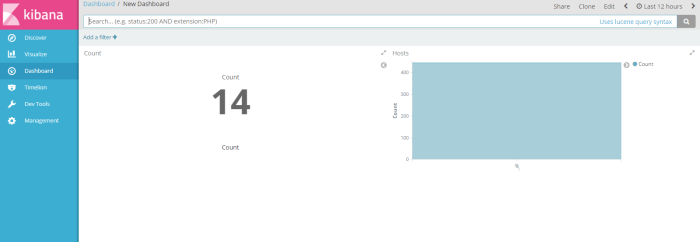
after visualize the result of filter information i will present all result filter search and chart to dashboard from menu “dashboard”

from menu dahsboard click add to create a dashboard profile

add to dashboardd

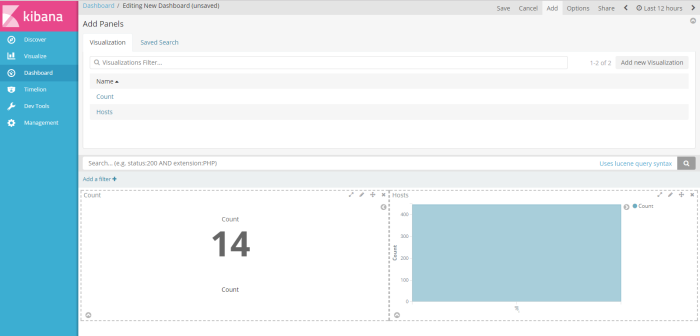
and the choose visualization profile have you crated to be shown on the dashboard, of course i choose 2 profile visualization i have created (host and Count) sample dashboard will be shown like on the picture below

add count and Hosts from virtualization filte

next, click save button on the right corner window to save the  profile as new dashboard profile, i save as “New Dashboard”

save as new dashboard

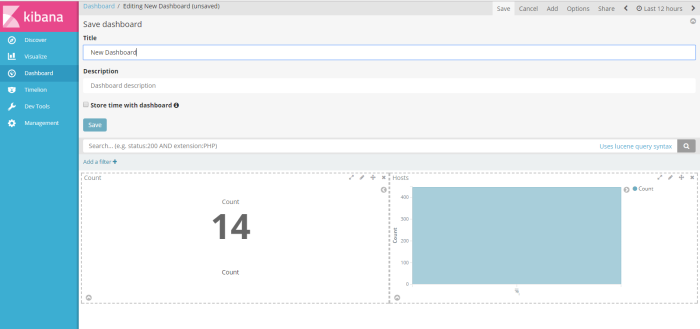
and then finnaly you have a new dashboard to infrom you, to your management or user about important information on your system status, security alert or application service alert, have you filter through query elasticsearch, from unstructure log data collected by logstash  into readable chart by kibana, Good Luck

New Dashboard