Hi All,
On this article, i wanna share to you about one of simple application monitoring, to check percentage availability of your application through uptime monitoring
“Uptime is remote monitoring application using Node.js, MongoDB, licensed under MIT license” open source and this is free. uptime monitoring is specified to monitor availability status and uptime your application, not to check CPU performance on your server not to monitoring Source Code performance on your application, or memory consume of your running application on the system
So lets start begin how to install this application, im install this application on my Linux Ubuntu System 14.04 LTS, for minimum requirement i used virtual server with spec
CPU : 2 Core
RAM : 4GB
Disk : 40 GB
================================================
a. Installation step
===============================================
Do update repository ubuntu
#sudo apt-get update
Install VIM text editor (iam usually used VIM as text editor on Linux system) 😛
#sudo apt-get install vim
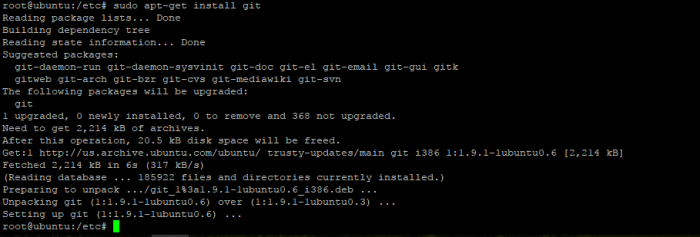
Install git for download Uptime package from Github Source Code Management (SCM)
#sudo apt-get install git
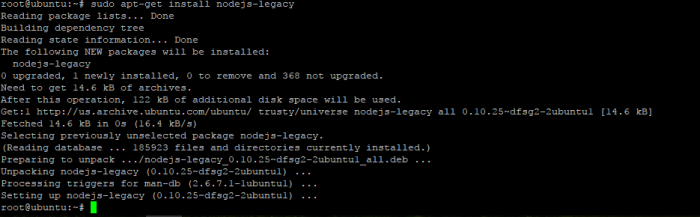
Install Node JS version 10 or Above (java script runtime)
#sudo apt-get install nodejs
#sudo apt-ge instal nodejs-legacy –> (dependency to start Application Uptime)
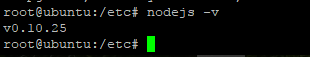
Check Node JS installation
#nodejs –v
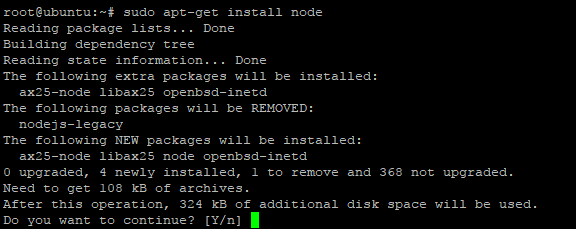
Install node (this node will be used when we started uptime application service)
#sudo apt-get install node
Install NPM
We will used NPM when install uptime from source code pakcage we downloaded from github to the system ubuntu
#sudo apt-get install npm
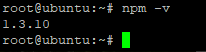
Check instalation npm
#npm –v
Installed MongoDB
Uptime monitoring will used mogoDB as Database application
Add mongoDB repository to ubuntu system
#sudo apt-key adv –keyserver hkp://keyserver.ubuntu.com:80 –recv 7F0CEB10
#echo “deb http://repo.mongodb.org/apt/ubuntu “$(lsb_release -sc)”/mongodb-org/3.0 multiverse” | sudo tee /etc/apt/sources.list.d/mongodb-org-3.0.list
Update repository with command
#sudo apt-get update
Do instalation with command
#sudo apt-get install mongodb
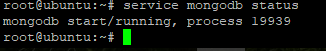
Check mongoDB status with command
#sudo service mongodb status
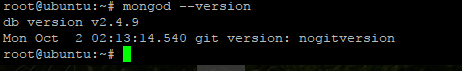
Check mongodb version with command
#mongod –version
Download uptime package from github used git clone tools
#sudo git clone git://github.com/fzaninotto/uptime.git
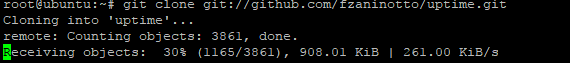
Make sure the package has already clone to your linux directory
#ls
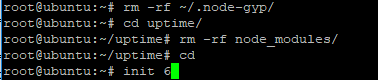
Delete ./node-gyp/ on ROOT directory with command
#rm -rf ~/.node-gyp/
Go to uptime directory and delete node_modules
#cd /uptime
~/uptime#rm -rf node_modules/
Restart the server, because we just delete some file from root directory
#sudo init 6
Install uptime monitoring
Go to directory uptime package
#cd uptime/
Install uptime with npm command
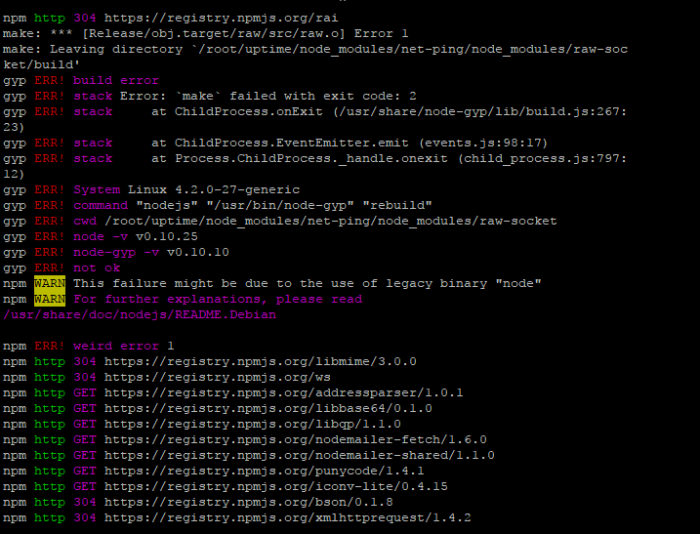
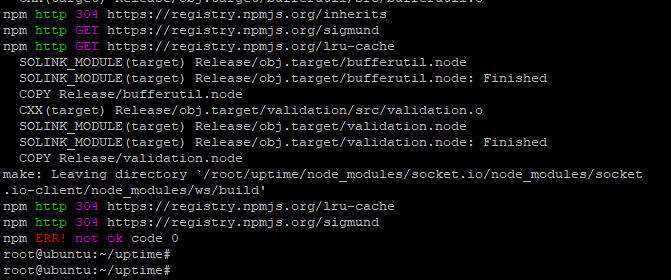
/uptime#npm install
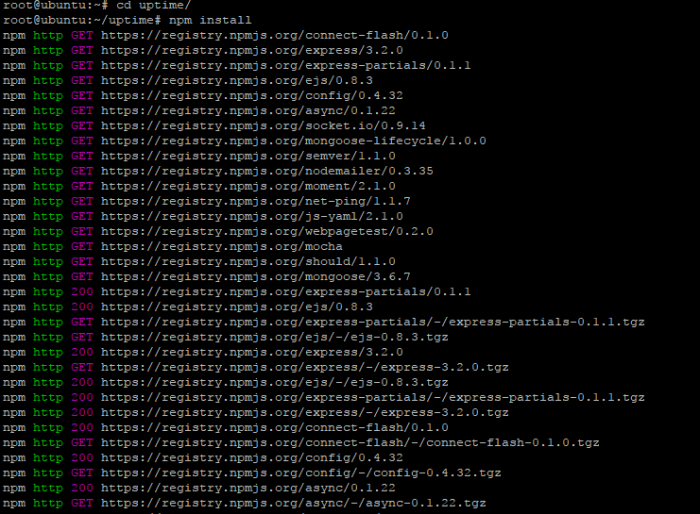
And the source code will download registry npmjs from https://registry.npmjs.org/
and put that registry to the uptime application
Note : when installed uptime you will find some error like on the picture below, that error related to the node_modules we have deleted before, so ignore it
==================================================================
B. Configure Uptime Monitoring and Start
========================================================
Start Uptime Application to environment production with command
/uptime#NODE_ENV=production node app
If you find error like on the picture below, this error because we must configure the uptime first to interconnect uptime application to mongoDB,
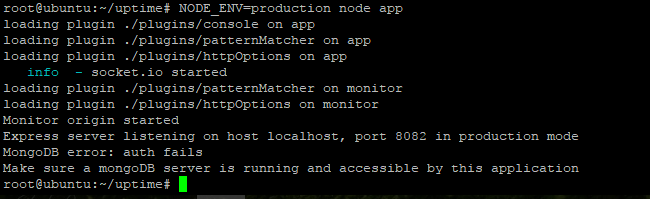
edit file configuration uptime
#cd /uptime/config
~/uptime/config#vim default.yaml
Change line configuration “connectionString: #”
To be :
connectionString: mongodb://localhost/uptime
This mean is, to connecting uptime to mongoDB without authentication
And dont forget to change timezone your linux, because we need correct time when we recognize our application is down, uptime get clock from ubuntu system
Used command to change timezone
#dpgk-reconfigure tzdata
Add TCP Monitoring on Uptime
On default uptime only can monitoring through http, https, UDP, Webpage Test, if we want to add new module and make Uptime can monitoring application application based on TCP port we must following this metod to add feature tcp monitoring on uptime
For safety when we edit this file configuration better we copy the real configuration file to other directory. For example i copy file config to my home directory
# cp uptime/lib/pollers/pollerCollection.js /home/lhutapea/pollerCollection.js.bak
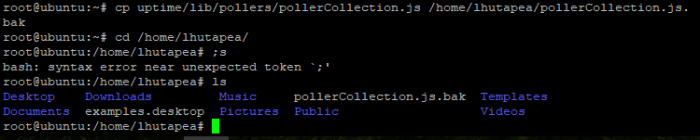
Add TCP monitoring with edit file pollerCollection.js
#cd /uptime/lib/pollers/pollerCollection.js
#vim pollerCollection.js
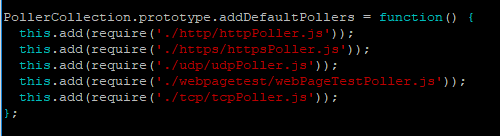
And add this config (+) to the line configuration pollers, so that configuration like on the below
PollerCollection.prototype.addDefaultPollers = function() {
this.add(require(‘./http/httpPoller.js’));
this.add(require(‘./https/httpsPoller.js’));
this.add(require(‘./udp/udpPoller.js’));
this.add(require(‘./webpagetest/webPageTestPoller.js’));
+ this.add(require(‘./tcp/tcpPoller.js’));
};
create new directory in the poller uptime diretory folder
#mkdir /uptime/lib/pollers/tcp
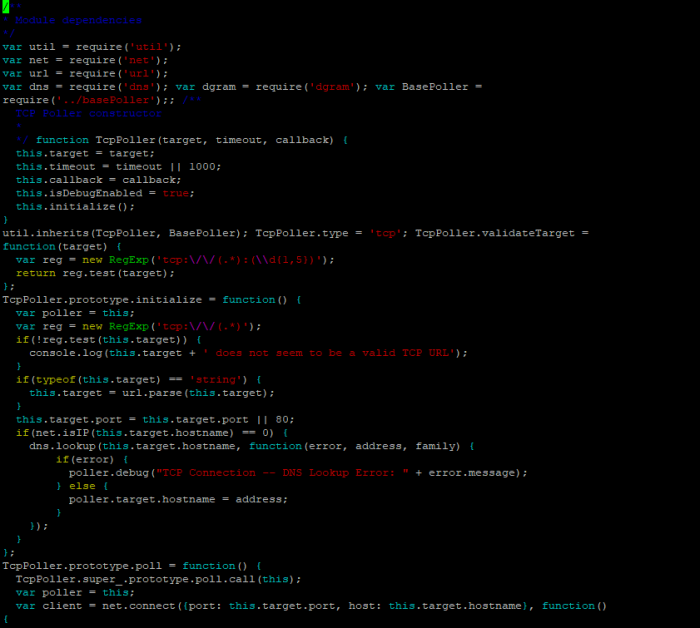
and create new file with this script
#vim /uptime/lib/pollers/tcp/tcpPoller.js
================
Script
===========
/**
* Module dependencies
*/
var util = require(‘util’);
var net = require(‘net’);
var url = require(‘url’);
var dns = require(‘dns’); var dgram = require(‘dgram’); var BasePoller =
require(‘../basePoller’);; /**
TCP Poller constructor
*
*/ function TcpPoller(target, timeout, callback) {
this.target = target;
this.timeout = timeout || 1000;
this.callback = callback;
this.isDebugEnabled = true;
this.initialize();
}
util.inherits(TcpPoller, BasePoller); TcpPoller.type = ‘tcp’; TcpPoller.validateTarget =
function(target) {
var reg = new RegExp(‘tcp:\/\/(.*):(\\d{1,5})’);
return reg.test(target);
};
TcpPoller.prototype.initialize = function() {
var poller = this;
var reg = new RegExp(‘tcp:\/\/(.*)’);
if(!reg.test(this.target)) {
console.log(this.target + ‘ does not seem to be a valid TCP URL’);
}
if(typeof(this.target) == ‘string’) {
this.target = url.parse(this.target);
}
this.target.port = this.target.port || 80;
if(net.isIP(this.target.hostname) == 0) {
dns.lookup(this.target.hostname, function(error, address, family) {
if(error) {
poller.debug(“TCP Connection — DNS Lookup Error: ” + error.message);
} else {
poller.target.hostname = address;
}
});
}
};
TcpPoller.prototype.poll = function() {
TcpPoller.super_.prototype.poll.call(this);
var poller = this;
var client = net.connect({port: this.target.port, host: this.target.hostname}, function()
{
poller.timer.stop();
poller.debug(poller.getTime() + “ms – TCP Connection Established”);
client.end();
poller.callback(undefined, poller.getTime());
});
client.setTimeout(this.timeoutReached, this.timeout);
client.on(‘error’, function(err) {
poller.debug(poller.getTime() + “ms – TCP Connection Error: ” + err.message);
client.end();
poller.callback(null, poller.getTime());
});
client.on(‘end’, function() {
poller.debug(poller.getTime() + “ms – TCP Connection End”);
});
};
module.exports = TcpPoller;
==========================================
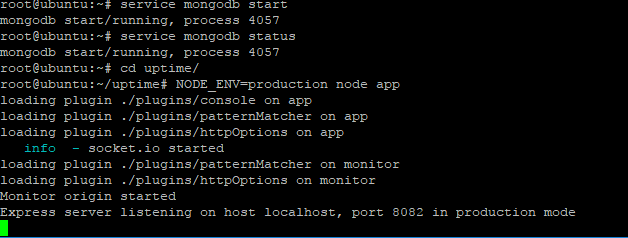
save the configuration and start uptime once again
check mongodb status with command
#service mongodb status
start the application uptime with command
#cd /uptime
/uptime#NODE_ENV=production node app
If service success started, it must be like picture on the below
====================================================
C. Access uptime and create Check your application Uptime
===================================================
Uptime app will start used service 8082, so can access uptime application from your browser with address:
http://ip address uptime:8082
and the first window is like on the picture below
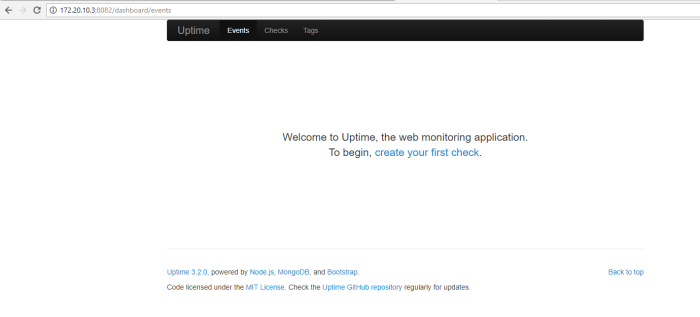
create first check monitoring with click word “create your first check”
and you will shown form new checks monitoring to your application, example create check uptime to your application is like picture below
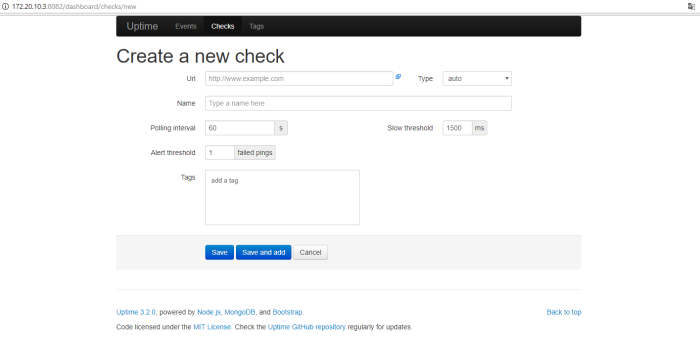
on this picture below you will see i create check uptime to website dell com used type http for example
i set polling interval each 60 Second, this mean every 60 second uptime will try triger check to dell website, and alert threshold will be generated if on the pooling time i get 2 times timeout ping, slow threshold my trigger is 1500 milisecond (1,5 Second), if you wanna grouped check application to category, you can tag the profile check, so the check profile will be categorize as a group through tag name
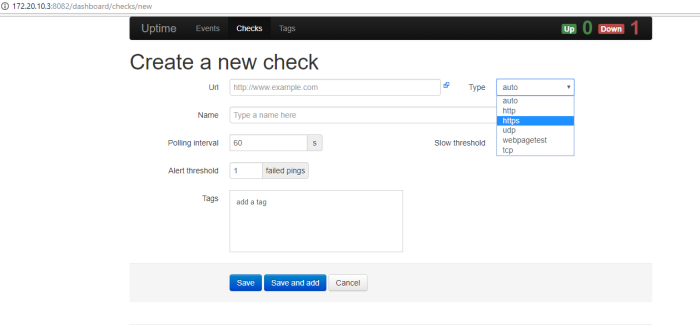
we can check our application used another type except http, we can used https, TCP or UDP, example type available will be shown in the picture below
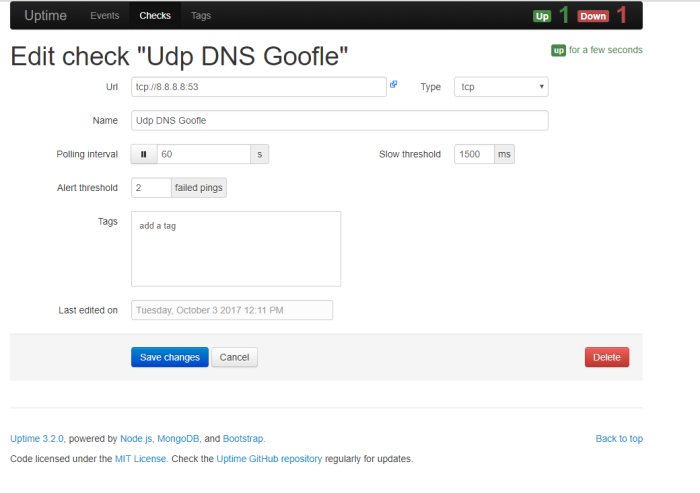
another example i wanna monitoring Google DNS service used type TCP on port DNS 53
like on this picture
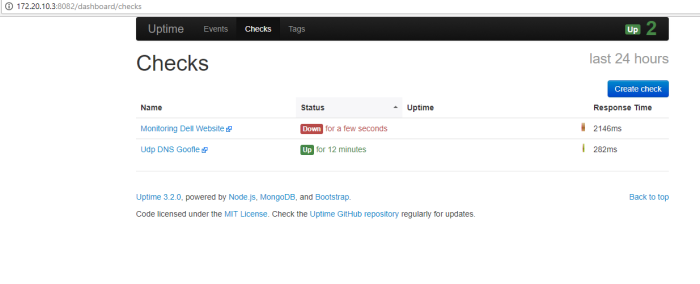
this is example list check monitoring i have created, we can see profile check have been created on the menu Checks like on this picture
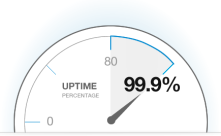
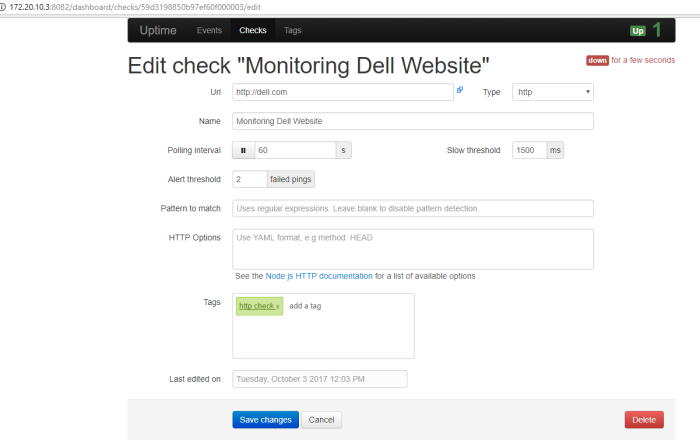
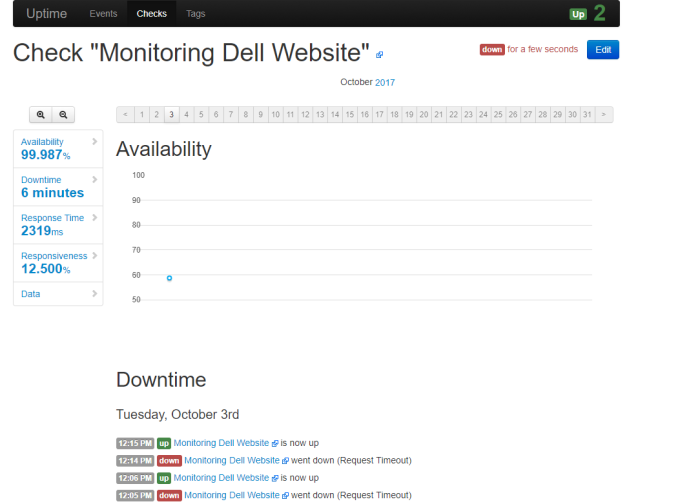
if we click the profile name of list checks we can see detail of percentage uptime availability of that application, for example i click profile check “Monitoring Dell website” and see application availability percentage and graph like on this picture
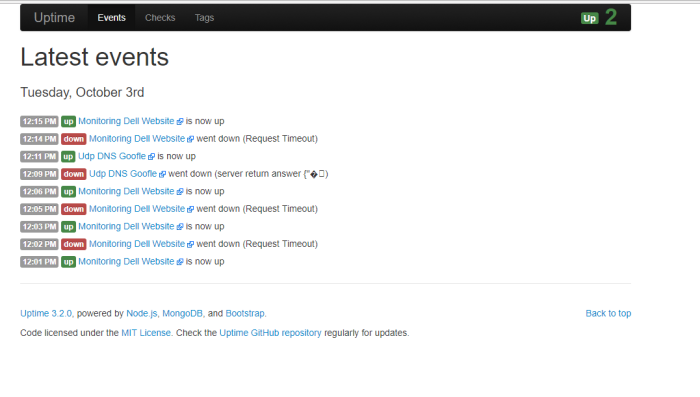
uptime have 3 main menus default, First is event
on the event we can see event history uptime status of application monitored by uptime
second is check, on the check we can create and see list of application minitored by uptime, to create new check uptime profile to our application click button “create check”
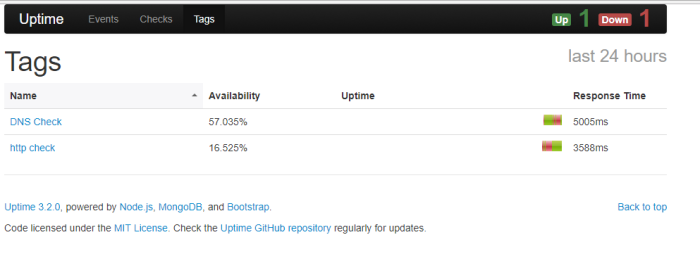
number three is “Tags” on this menu we can see list of profile check uptime as group tag
This is all i can share from this topic, hope this will help you
Thanks
