Python Scripting For Network Engineer (Paramiko Part2)

python-logo-master-v3-TM

Hi,

Welcome to my article about  Python Scripting for Administration and Automation Management Network Device used Paramiko Part 2, in previous section i was introduce to you about what is python paramiko, and what we can do used paramiko in our infrastructure operation.

oke i help you to remember, Paramiko is python interface around SSH networking, this method was used on Ansible as Configuration management, remote execution, automation deployment, to your system and IT infrastructure without agent installation on your system (Agentless). so in this article i used paramiko with a little bit python scripting to create simply tools application and used that tools to remote my network device or system to get information  what i need used remote execute command. to do configuration task, i will show you on next section.

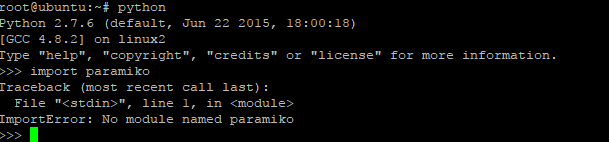
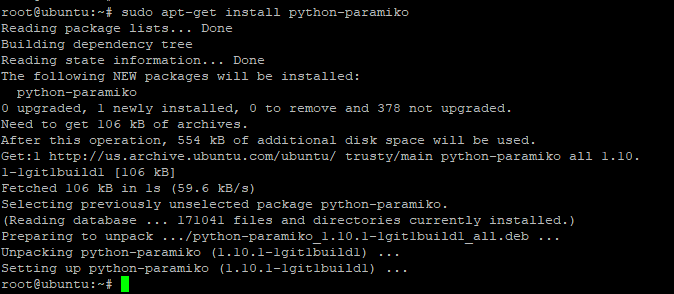
i was show to you from previous section (Paramiko-Part1) how to install and used python-paramiko to execute script and create remote session to remote device, so i assumed you have understand and i can continue to python script and explanation.

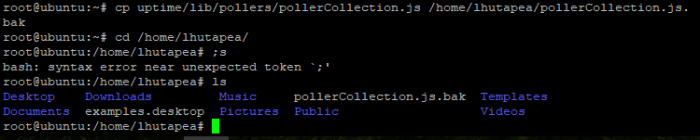
create python script on your linux system (i used Ubuntu 14.04 LTS) with command

#vim paramiko-show.py

i will separate script and give the explanation

Banner

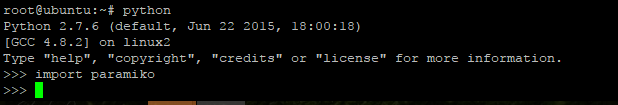
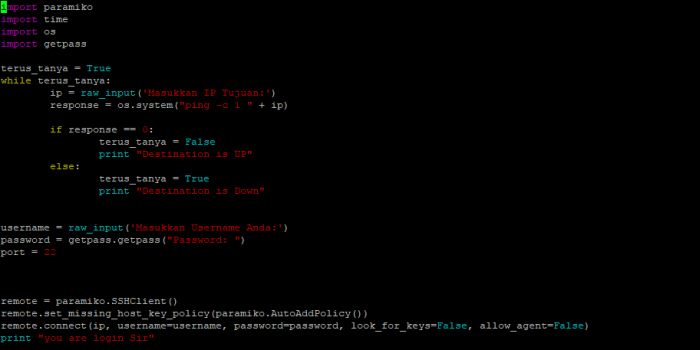
#Noted : on this part i declare and import module paramiko to python script so i can called that module when i execute my script

Banner 2

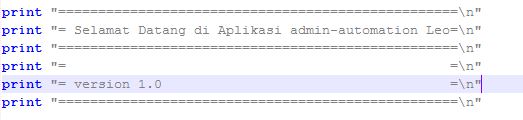
#Noted : This is Banner my application tools (its funny right..LuL)

Remote inizialisation


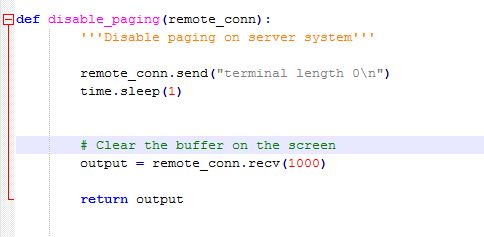
# Noted : this pieces  is code initialization i create remote connection from my terminal, do sleep session in one second “time.sleep(1)” till remote session created done and save output remote session to variable  named “output”

Ping

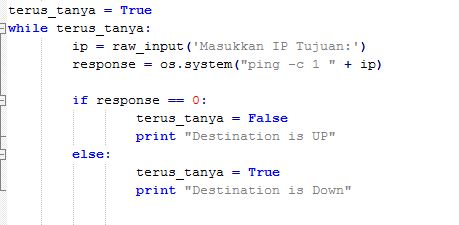
#Noted : This Script is python while loop to check are host destination we want to remote is on UP or Down Condition, user will input Address destination host which will remote and save the value on variable “ip”, and do command “ping -c 1” to ip destination (ping at once count) used “module os” i have import at top and save the value to variable response. next i do python if and else condition in python while loop function, if the value variable “response”  while loop  is Zero (Success) print command in terminal “Destination is UP” while loop will be end “False” and execution will continue to next script, if the value “response” other than Zero, print command “Destination is Down” and looping will be happend and ask user to input destination host

Login Username Session

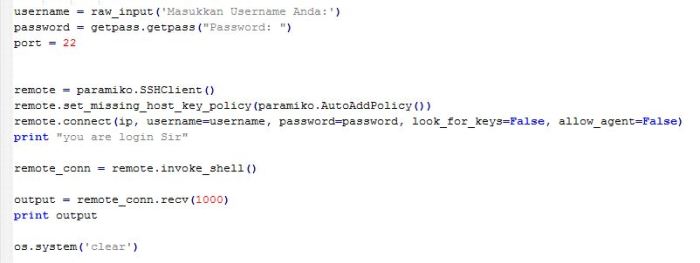
#Noted : on this piece code i used raw_input string to get value from user, and save the input to variable username for username user, and password to password input from user, i used getpass portable password input to hide value password user when they write it on terminal.

on the second piece script i do python paramiko function to called SSH client and do remote connection used value on variable “ip, username, and password”, then when connection success terminal will print info “you are login sir”, show result remote session and clear terminal when its done

Menu and If condition 1

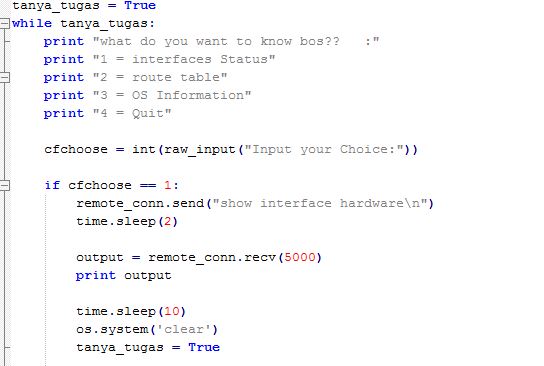
Note : in this piece code i do python while loop again to choose menu section after we success login to system the remote host, this menu is option to get information or status from your remote host/device, on this example i  created  remote command to get information from my palo alto firewall like Interface status, route table and software information through choose option.

user will give they inpute choose on integer value and we will save that value on variable “cfchoose“, then from that input user value on variable cfchoose we will create if else condition on python while loop choose menu section.

if user give the integer input number 1 which that mean want to know interface status palo alto device, paramiko will send remote command palo alto “show interface hardware” to get information interface status  of palo alto device, do time sleep on 2 second till all the output success shown, then save that result on variable “output” and print it to our terminal. do time sleep on 10 second till user done to see and capture the result then do clear terminal and looping back to choose menu option

Menu and If condition 2

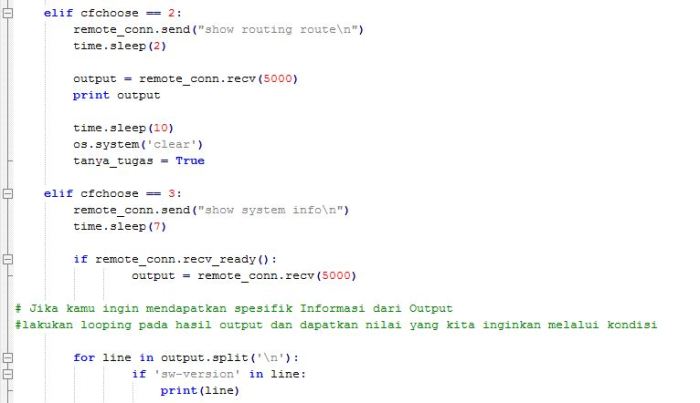
Note : in the example script above, if user choose option number 2 which mean user want to show routing table in this terminal from remote palo alto device, paramiko will send remote command palo alto to show the route table that firewall device with comamnd “show routing route”, do sleep time till all output from remote command shown and save the value to variable output, then show that result to the terminal. next do time sleep on 10 second so user can see and capture the result, before we clear terminal output and looping back to choose menu options

Next section if user choose option number 3 which mean want to know OS version of palo alto firewall device, paramiko will send remote command to palo alto via SSH to get system information used command “show ystem info”, this command will show to you about all system information of palo alto device, like hostname, SN, OS version, Wildfire and many more, but in this case we just want get specific information from that all value we can get from system information, i just want to know the OS version so in this case i used another method from 2 script cfchoose section we have seen before, after do remote command to palo alto, i save the value to variable output, then i do for loop python on section if else cfchoose, i will loop all value i have save on variable output and put it on variable  line  and do if condition againts, if on this loop i get  ‘sw-version’ i will put that value on variable line and show it to the terminal, next do time sleep on 10 second so user can see and capture the result, before we clear terminal output and looping back to choose menu options

Menu and If condition 3 and negative condition

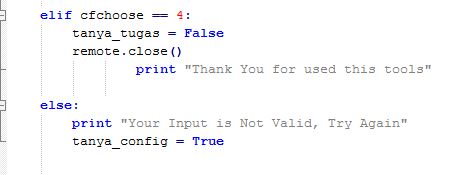
Note :  if user choose option number 4 which mean  user want to exit from this application, script will stop python while loop  for choose menu option, close remote session SSH to remote host/device and print information “thank you for used this tools”

and the last is “else” the negative condition, it will show when input user on while loop choose menu option is not valid, it will print info “Your input is not valid, try again” then do looping back to input user on choose menu option

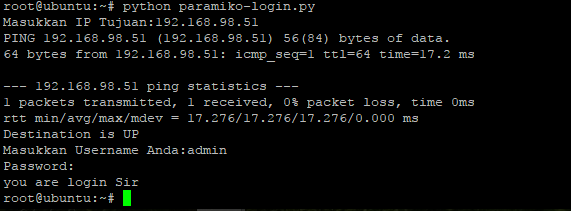
In the picture below i show to you how this application is working :

First

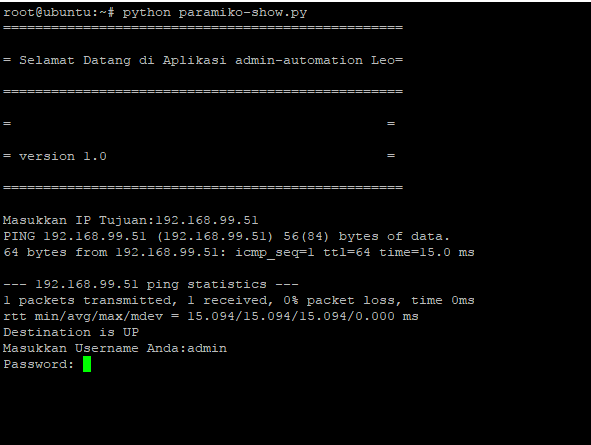
picture above is section when i run the python script, input address remote host/device and login used my cridential to palo alto device

Two

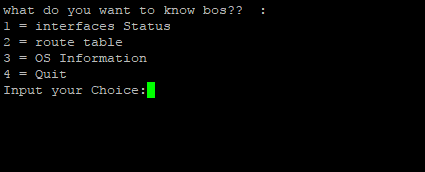
after we success login, we will see choose option menu, to choose what we will do from their option menu

three

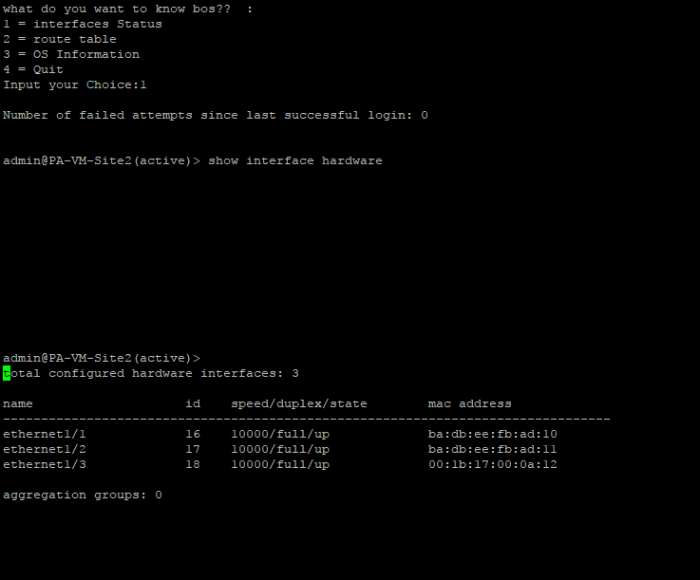
picture above is example if we choose option one which mean, want to know interface status of palo alto firewall

Thress

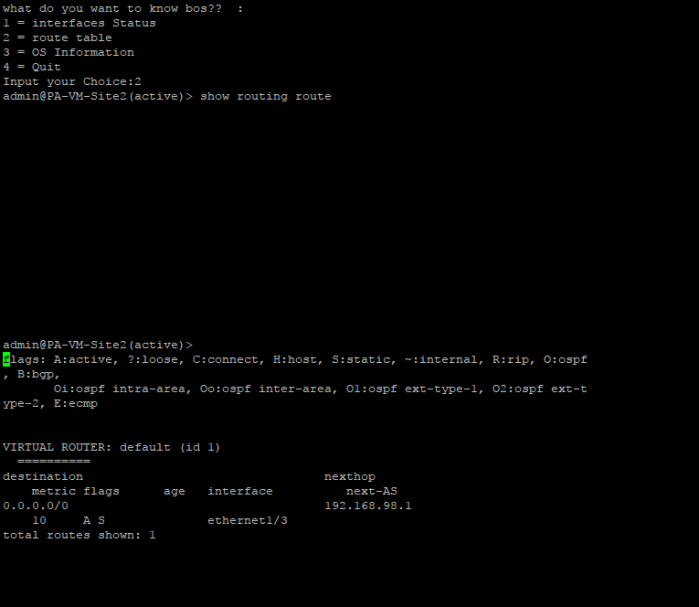
picture above is example if we choose option 2 which mean show route table of palo alto device

four

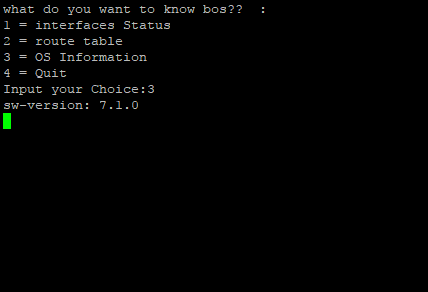
picture above is example if we choose option 3 which mean show OS Version palo alto device from system information value

five

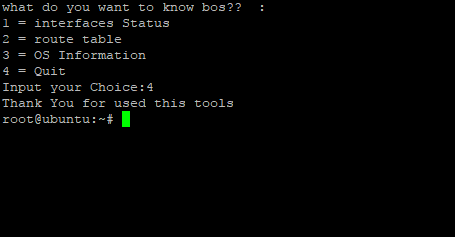
picture above is example if we choose option 4 which mean want to out from this application
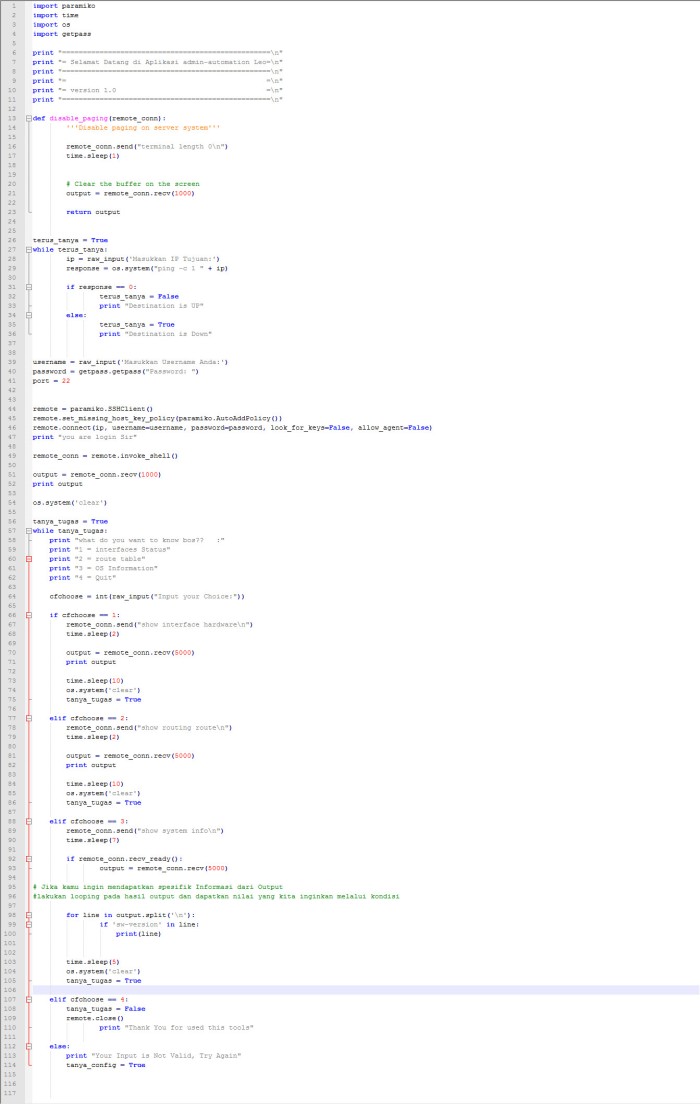
Full Script

All script

Okay , thats all i can share to you on this article, on the next section we will try to create application configuration for network device used python paramiko scripting

Thanks


Python Scripting For Network Engineer (Paramiko) Part-1

python-logo-master-v3-TM

Wake up on 5.00 AM GMT+7, i start thinking what should i do on this morning, better im playing Dota 2 😛 or Write Some article. and my heart say something sh*t like, used your time for something useful and be a good person with helping each other.

This article is my promise to you from previous article,when im talking about ansible, i was promise to you i will create a new session about what is paramiko? And example scripting used paramiko phyton to manage your network device

1. What is paramiko :

Paramiko is a Python (2.6+, 3.3+) implementation of the SSHv2 protocol [1], providing both client and server functionality. While it leverages a Python C extension for low level cryptography (Cryptography), Paramiko itself is a pure Python interface around SSH networking concepts.

  • Paramiko is python interface around SSH networking
  • I will used it connect to Network Device or Linux System
  • After Create Connection you can execute any task with python script or run other bash script on linux system
  • More Information you can get at http://www.paramiko.org

2. How to install paramiko phyton

In this article i still used ubuntu 14.04 LTS to run my python script, on default ubuntu dont have paramiko phyton module on that system, we can check used python interface from linux terminal

Go to phyton interface with command

#python

and try to import module paramiko on python script, like example picture below

> import paramiko

Import paramiko

So we will install module paramiko python first to ubuntu system with command

#sudo apt-get update

#sudo apt-get install python-paramiko

On the picture above we can see, import module was error “ImportError : No module named paramiko”

Install paramiko

After we success installed paramiko python on our system, next we try again to import module paramiko again to our python script, its should be success

Import paramiko Succcess

as you can see, we not get error message when we import paramiko on python script

3. Using paramiko on python scripting

Next we will create a simple basic python scripting used python paramiko to do a remote connection to network device, just test remote connection used python paramiko, so you will understand  basic simple scripting using python paramiko. create file python script with command

#vim paramiko-login.py

And create python script like example on the below

============================================================

import paramiko <call module paramiko>
import time
import os
import getpass

terus_tanya = True
while terus_tanya: <<<<<<<<<<<<<<<looping function and conditions>
ip = raw_input(‘Masukkan IP Tujuan:’)
response = os.system(“ping -c 1 ” + ip)

if response == 0:
terus_tanya = False
print “Destination is UP”
else:
terus_tanya = True
print “Destination is Down”

username = raw_input(‘Masukkan Username Anda:’) <input string>
password = getpass.getpass(“Password: “) <save password used module getpass>
port = 22

/*Noted : on this script i used function raw_input phyton to make user give input value and save the value to username variable, because i dont want to defined  username and showed the usename value on this script and used getpass function to password cridential, because i dont want when user input they password it will showed on command prompt*/

remote = paramiko.SSHClient()
remote.set_missing_host_key_policy(paramiko.AutoAddPolicy())
remote.connect(ip, username=username, password=password, look_for_keys=False, allow_agent=False)
print “you are login Sir”

/*above is script to called SSH function and do login session with SSH protocol*/


===============================================================

Script one right

Save python script login parramiko to a file

4. give grant permission on ubuntu system to execute that python script with command

#sudo chmod 111

Permission file

And check file permission with command

#ll or ls -l

Paramiko permission status

5. Now we can execute the python script with command

#python paramiko.py

on this i will do a remote session used python paramiko script from my ubuntu system on IP 192.168.98.155 to Security Device Palo Alto on IP 192.168.98.51 through SSH protocol, the result i show to you on the example picture below

Test Script

Example picture above show we success execute python scripting and success login to security device palo alto on ip 192.168.98.51

To make sure our python script success We must check on Palo Alto dashboard log system to get information IP ubuntu system ex (192.168.98.155) have success create SSH connection to palo alto and success do auhtentication admin

authentication paramiko on dashboard palio

From picture above its look like we success login to palo alto device used python paramiko. and this is a end of session article Python Paramiko Part 1

next section, we will create python script to get information on device after we success login to their system with paramiko python scripting, try to configure device, and many more, the last we will create simple application tools to manage our network device via paramiko python scripting

hope you enjoyed it, Thanks


(Squid) forward Proxy for Internet Access Control and Visibility


squid_proxy_logo

Hi all,

Have you ever get problem about bandwidth on your office always get exhausted, even upgrade the capacity your internet link bandwidth its not solution to solve your problem, and your boss start asking  you, what happend to our internet? why its so slow even we increase the bandwith capacity, can you show  internet access information  from this office to internet, i wanna know what they access to the internet on office hour and what type of traffic access have consume our bandwidth ? what you will answer to your boss??

One of solution to answer your problem is to put forward proxy to controll user access to internet website used Access List from URL list address and log the information website access  to analyze what next policy should be implement to controll internet access and generate report to your boss about visibility what their access, who access that website, and when.

on this article i used one of legend  proxy server to control user website access to the internet, its open source and free,… yes the name is Squid proxy. are squid have another feature except Internet Access Control?? Suree….. you can check squid feature on their website https://wiki.squid-cache.org/Features but on this article i wanna used squid as Internet Access Control and management, with visibility information about what website they already access, who access the website, when they access that website.

On vendor product appliance we know “ProxySG” with feature WebFilter from BlueCoat System, or Sangfor (IAM)  Internet Access Management have similar function like SQUID Proxy.

First we will installed squid proxy on Linux Ubuntu System 14.04 LTS 64 bit.

a. Installation

do update repository your Ubuntu System

#sudo apt-get update

install squid 3 to the system

# sudo apt-get install squid

1

Squid Version

check squid instalation and service status

#sudo service squid3 status

#netsat -an | grep tcp

netstat -n

default port service squid 3 is 3128

location directory configuration squid3 is /etc/squid3

file on squid

location directory log access  Squid3 is /var/log/squid3/


On this step, you already install squid3  proxy to your ubuntu system

b. Configuration SQUID

for safety configuration do copy original file configuration squid to your home directory
#sudo cp /etc/squid3/squid.conf /home/lhutapea/squid.conf.bak

change listener service default proxy (3128) to new service (ex)8181
edit file squid.conf with command

#vim /etc/squid3/squid.conf

change line below :

http_port 3128
to
http_port 8181

change port service

restart squid3 service to get effect new configuration with command

#sudo service squid3 restart

check status squid service with command

#sudo service squid3 status

Status Squid

that service proxy have been change to port 8181

after change service

Configure user  browser to used squid proxy server, for example on the Mozilla Firefox you can setting proxy from menu options –> Advanced –> Network –> Settings and do configuration like on the picture below

Proxy Sett browser

on this step when we seting our client computer to used squid proxy on the browser, that computer will unable access website on internet, this is because default policy  squid proxy configuration is deny all connection http access, so the first thing is we must defined policy access list (ACL) to allow our user access to the internet website based on specific criteria.

Deny All

1. acl base on network segment

on first example we will allow client to able  do http access when the user used IP segment 172.20.10.0/28

create acl on squid configuration and allow ip network 172.20.10.0/28 can do http access like example on the picture below

#sudo vim /etc/squid3/squid.conf

Allow Network

restart squid service to get effect change configuration

#sudo service squid3 restart

and test your http access from your browser, if your client computer used network segment 172.20.10.0/28 you shold be able access website internet, if you cant access website access you can check the log access on directory /var/log/squid3/access.log

#sudo tail -f /var/log/squid3/access.log

2. acl base url domain request

On the second example we will create access list client will be able do http access if their access to the specific website url, for example they will be able access facebook.com and youtube.com, and denied http access to other website url

create acl configuration like on the picture below

Allow Specific Domain

3. acl base on user cridential digest file

On this acl configuration example, we will allow user do http access when he success do proxy login used user credential from digest file, to make squid proxy ask login  credential when user open their browser,  we will do some configuration first

do install apache2-utils to create web authentication proxy access
#sudo apt-get install apache2-utils

set user proxy authentication
#sudo htdigest -c /etc/squid3/passwords realm_name user_name

for example
#sudo htdigest -c /etc/squid3/passwords fachri afachri <Enter>
New password:
Re-type new password:

i have create user fachri to file directory /etc/squid3/passwords with username afachri and enter that password

after we install htdigest next step we will make browser challenge username and password form when we used squid proxy to access internet website,

edit squid configuration  to be configuration line like on the below

#sudo vim /etc/squid3/squid.conf

edit config authentication digest file

that config above will make browser client used squid as proxy will get authentication challenge before they can access website on the internet, if they cant success conection http access will be blocked,

Username and password question

4. ACL Base Authentication Digest File and Regex List Domain File

On this example we will try configuration acl policy user access to internet website base authentication digest file and list allowed domain file, so when user success login to proxy server he will allow do http access only to specific domain name already defined used regex on file list domain.

firts we must create file  with list domain name will allowed access by client after they success login to proxy,

create file allowed_domain.txt on directory /etc/squid3

#vim /etc/squid3/allowed_domain.txt

then create list domain will allowed access by user client used regular expresion like example picture on the below

allow domain regex

on this example i have create list domain name google and galaxidata, is the only domain name will be allowed access by client after they success login to proxy server

next, edit configuration on squid.conf, so that policy can be applied when computer client using squid as proxy server on their browser

edit file squid.conf

#vim /etc/squid3/squid.conf

Regex

then restart your squid proxy service to get configuration effect

#sudo service squid3 restart

test your configuration policy acl on squid proxy, access some website, login to proxy server, then access website google, its must be allowed, then try access another website like apple.com, its should be not allowed

5. Policy acl base authentication Active Directory used LDAP Protocol

On this example we will change authentication method used by proxy with joining this proxy to active directory used LDAP Protocol, actually squid can joined to AD base on Karberos, but i choose LDAP because is common protocol, so you can joined to AD  windows server or LDAP server on linux system

first we  create user credential on active directory and that user will used by squid proxy to join to active directory and able query to directory domain name

1. Create user squidproxy on active directory user and computer on menu

Server Manager >> Tools >> Active Directory Users and Computers,  right click and click New, then create new user like example picture on the below

Squid user step 1

next fill the password

Squid user step 2

next and finish

Squid user step 3

when we succes create new user on Active Directory the new username account will be listed on user directory,

next right click the new user name then click properties

Squid user step 4

on the tab member of  click  add button to joining the new user profile to another group member:

  • Distributed COM
  • Event Log Readers
  • Server Opertor

Squid user step 5

result should be like example picture on the below

Squid user step 6

click Apply and OK

2. Create WMI permission to the user squidproxy through WMI Control

go to search on windows server, and write wmimgmt.msc then enter

you should be shown WMI Controll like example picture on the below,

right click  WMI Control (local) >> properties >> Security explore folder Root

choose folder CIMV2 >> Security

Squid user step 7


click button add and fill username squidproxy to Security for ROOT\CIMV2 like example picture on the below

Squid user step 8

then give grant permission on that user on WMI Control like example picture on below

Squid user step 9

Click Apply and OK to agreed configuration setting on Security WMI Control

3.Edit Squid Configuration and joined Squid to Active Directory Used Protocol LDAP

next step we will edit configuration squid.conf to join squid proxy to active directory used protocol LDAP. edit squid configuration like example on the below

=========================================================================

auth_param basic program /usr/lib/squid3/basic_ldap_auth -b “dc=galaxidata,dc=local” -D cn=squidproxy,cn=Users,dc=galaxidata,dc=local -w squidproxy123 -f “sAMAccountName=%s” -c 2 -t 2 -h 192.168.98.44 (Note: this configuration must be on one line)

auth_param basic children 10
auth_param basic realm pengguna
auth_param basic credentialsttl 1 hours

acl ldapauth proxy_auth REQUIRED
acl boleh dstdom_regex -i “/etc/squid3/allow_domain.txt”
http_access allow ldapauth boleh

=========================================================================

-b = <domain name your AD

-D = <Canonical name user account that squid used join to active directory, example squidproxy>

-w = <password user account squidproxy>

-f = <Used format username sAMAccountName active directory to squid  do a query  to AD server for identified existance of user

-h = <IP address Active Directory>

Config LDAP Auth Squid Must One Line

restart squid proxy service to get effect changing configuration, and test user to login on squid proxy server when access internet website used their AD username and password and when success do testing access to domain name allowed  by squid proxy  based on list allowed_domain.txt and test to website should be denied by squid proxy.

on this step we have success to control internet access of user by policy acl on squid proxy,based on login active directory and allowed only to specific website, actually we can schedule the policy acl too, if you wanna  see information  access website by user you can find it on /var/log/squid3/access.log, example log information access shown on the picture below

Log Access 2

next step we will configure squid proxy can generate that log information accessto be a report  about information who access the website, when, and what the website they access

C. Create Reporting

On this article i will configure squid reporting used SARG (Squid Analysis Report Generatot), this tools will generate access.log squid to be a good report, and we can present to your boss.

1. install SARG on Ubuntu 14.04 used command

#sudo apt-get install sarg

SARG Version

2. we need install apache2 too, so we can access SARG from our browser

#sudo apt-get install apache2

after installation success we will edit configuration of SARG, do step configuration below to integrated SARG to squid proxy

3. Edit SARG configuration

edit SARG configuration file with command

#sudo vim /etc/sarg/sarg.conf

and change default value SARG configuration to  the new one

change access_log directory path value to be:

Config SARG1

Change Output directory path value to be:

SARG Output

Change Date format to Europe Format DDMMYY

Date SARG

Change Graph_font path directory to be:

Font SArg

4. Start SARG to load new configuration setting with command

#sudo sarg -x

Succes Start

5. Access SARG used your browser with url address http://<IP Proxy Server>/squid-reports

and you will see example report generated from access.log proxy like exapmle picture on the below

SARG testing

on the example image above we can see top list user consumed bandwith on period 06-09 oct 2017 is  USERID active directory with name dratnasari, click the name USERID dretnasari to see detail list domain website he already access on time period, and the result will shown on the example  picture  below

Dratnasri Access   Thats all i can share to you on this article, good luck


Uptime (Simple Monitoring for Availability Application) on Ubuntu 14.04

uptime-monitor

Hi All,

On this article, i wanna share to you about one of simple application monitoring, to check percentage availability of your application  through uptime monitoring

Uptime is remote monitoring application using Node.js, MongoDB, licensed under MIT license” open source and this is free. uptime monitoring is specified to monitor availability status and uptime your application, not to check CPU performance on your server not to monitoring Source Code performance on your application, or memory consume of your running application on the system

So lets start begin how to install this application, im install this application on my Linux Ubuntu System 14.04 LTS, for minimum requirement i used virtual server with spec

CPU : 2 Core

RAM : 4GB

Disk : 40 GB

================================================

a. Installation step

===============================================

Do update repository ubuntu

#sudo apt-get update

Install VIM text editor (iam usually used VIM as text editor on Linux system) 😛

#sudo apt-get install vim

Install git for download Uptime package from Github Source Code Management (SCM)

#sudo apt-get install git

1

Install Node JS version 10 or Above (java script runtime)

#sudo apt-get install nodejs

#sudo apt-ge instal nodejs-legacy     –> (dependency to start Application Uptime)

3

Check Node JS installation

#nodejs –v

2

Install node (this node will be used when we started uptime application service)

#sudo apt-get install node

4

Install NPM

We will used NPM when install uptime from source code pakcage we downloaded from github to the system ubuntu

#sudo apt-get install npm

Check instalation npm

#npm –v

5

Installed MongoDB

Uptime monitoring will used mogoDB as Database application

Add mongoDB repository to ubuntu system

#sudo apt-key adv –keyserver hkp://keyserver.ubuntu.com:80 –recv 7F0CEB10

#echo “deb http://repo.mongodb.org/apt/ubuntu “$(lsb_release -sc)”/mongodb-org/3.0 multiverse” | sudo tee /etc/apt/sources.list.d/mongodb-org-3.0.list

Update repository with command

#sudo apt-get update

Do instalation with command

#sudo apt-get install mongodb

Check mongoDB status with command

#sudo service mongodb status

8

Check mongodb version with command

#mongod –version

9

Download uptime package from github used git clone tools

#sudo git clone git://github.com/fzaninotto/uptime.git

10

Make sure the package has already clone to your linux directory

#ls

11.PNG

Delete ./node-gyp/ on ROOT directory with command

#rm -rf ~/.node-gyp/

Go to uptime directory and delete node_modules

#cd /uptime

~/uptime#rm -rf node_modules/

Restart the server, because we just delete some file from root directory

#sudo init 6

13

Install uptime monitoring

Go to directory uptime package

#cd uptime/

Install uptime with npm command

/uptime#npm install

14

And the source code will download registry npmjs from https://registry.npmjs.org/

and   put that registry to the uptime application

Note : when installed uptime you will find some error like on the picture below, that error related to the node_modules we have deleted before, so ignore it

err1

err2

==================================================================

B. Configure Uptime Monitoring and Start

========================================================

Start Uptime Application to environment production with command

/uptime#NODE_ENV=production node app

If you find error like on the picture below, this error because we must configure the uptime first to interconnect uptime application to mongoDB,

15

edit file configuration uptime

#cd /uptime/config

~/uptime/config#vim default.yaml

Change line configuration “connectionString: #”

To be :

connectionString: mongodb://localhost/uptime

This mean is, to connecting uptime to mongoDB without authentication

And dont forget to change timezone your linux, because we need correct time when we recognize our application is down, uptime get clock from ubuntu system

Used command to change timezone

#dpgk-reconfigure tzdata

Add TCP Monitoring on Uptime

On default uptime only can monitoring through http, https, UDP, Webpage Test, if we want to add new module and make Uptime can monitoring application application based on TCP port we must following this metod to add feature tcp monitoring on uptime

For safety when we edit this file configuration better we copy the real configuration file to other directory. For example i copy file config to my home directory

# cp uptime/lib/pollers/pollerCollection.js /home/lhutapea/pollerCollection.js.bak

17

Add TCP monitoring with edit file pollerCollection.js

#cd /uptime/lib/pollers/pollerCollection.js

#vim pollerCollection.js

And add this config (+) to the line configuration pollers, so that configuration like on the below


PollerCollection.prototype.addDefaultPollers = function() {
this.add(require(‘./http/httpPoller.js’));
this.add(require(‘./https/httpsPoller.js’));
this.add(require(‘./udp/udpPoller.js’));
this.add(require(‘./webpagetest/webPageTestPoller.js’));
+ this.add(require(‘./tcp/tcpPoller.js’));
};


18

create new directory in the poller uptime diretory folder

#mkdir /uptime/lib/pollers/tcp

and create new file with this script

#vim /uptime/lib/pollers/tcp/tcpPoller.js

================

Script

===========

/**
* Module dependencies
*/
var util = require(‘util’);
var net = require(‘net’);
var url = require(‘url’);
var dns = require(‘dns’); var dgram = require(‘dgram’); var BasePoller =
require(‘../basePoller’);; /**
TCP Poller constructor
*
*/ function TcpPoller(target, timeout, callback) {
this.target = target;
this.timeout = timeout || 1000;
this.callback = callback;
this.isDebugEnabled = true;
this.initialize();
}
util.inherits(TcpPoller, BasePoller); TcpPoller.type = ‘tcp’; TcpPoller.validateTarget =
function(target) {
var reg = new RegExp(‘tcp:\/\/(.*):(\\d{1,5})’);
return reg.test(target);
};
TcpPoller.prototype.initialize = function() {
var poller = this;
var reg = new RegExp(‘tcp:\/\/(.*)’);
if(!reg.test(this.target)) {
console.log(this.target + ‘ does not seem to be a valid TCP URL’);
}
if(typeof(this.target) == ‘string’) {
this.target = url.parse(this.target);
}
this.target.port = this.target.port || 80;
if(net.isIP(this.target.hostname) == 0) {
dns.lookup(this.target.hostname, function(error, address, family) {
if(error) {
poller.debug(“TCP Connection — DNS Lookup Error: ” + error.message);
} else {
poller.target.hostname = address;
}
});
}
};
TcpPoller.prototype.poll = function() {
TcpPoller.super_.prototype.poll.call(this);
var poller = this;
var client = net.connect({port: this.target.port, host: this.target.hostname}, function()
{
poller.timer.stop();
poller.debug(poller.getTime() + “ms – TCP Connection Established”);
client.end();
poller.callback(undefined, poller.getTime());
});
client.setTimeout(this.timeoutReached, this.timeout);
client.on(‘error’, function(err) {
poller.debug(poller.getTime() + “ms – TCP Connection Error: ” + err.message);
client.end();
poller.callback(null, poller.getTime());
});
client.on(‘end’, function() {
poller.debug(poller.getTime() + “ms – TCP Connection End”);
});
};
module.exports = TcpPoller;

==========================================

20

save the configuration and start uptime once again

check mongodb status  with command

#service mongodb status

start the application uptime with command

#cd /uptime

/uptime#NODE_ENV=production node app

If service success started, it must be like picture on the below

21

====================================================

C. Access uptime and create Check your application Uptime

===================================================

Uptime app will start used service 8082, so can access uptime application from your browser with address:

http://ip address uptime:8082

and the first window is like on the picture below

22

create first check monitoring with click word “create your first check”

and you will shown form new checks monitoring to your application, example create check uptime to your application is like picture below

23

on this picture below you will see i create check uptime to website dell com used type http for example

25

i set polling interval each 60 Second, this mean every 60 second uptime will try triger check to dell website, and alert threshold will be generated if on the pooling time i get 2 times timeout ping,  slow threshold my trigger is 1500 milisecond (1,5 Second), if you wanna grouped check application to category, you can tag the profile check, so the check profile will be categorize as a group through tag name

we can check our application used another type except http, we can used https, TCP or UDP, example type available will be shown in the picture below

24

another example i wanna monitoring Google DNS service used type TCP on port DNS 53

like on this picture

26

this is example list check monitoring i have created, we can see profile check  have been created on the menu Checks like on this picture

Check

if we click the profile name of list checks we can see detail of percentage uptime availability of that application, for example i click profile check “Monitoring Dell website” and see application availability percentage and graph like on this picture

Monitor Del Website

uptime have 3 main menus default, First is event

on the event we can see event history uptime status of application monitored by uptime

Events

second is check, on the check we can create and see list of application minitored by uptime, to create new check uptime profile to our application click button “create check”

Check

number three is “Tags” on this menu we can see list of profile check uptime as group tag

TAG

This is all i can share from this topic, hope this will help you

Thanks