Hi All,
Today i wanna write about one of platform data analytic engine (elasticsearch) to analysis data and information from dynamic data collection (logstash), then we can visualize and present that data to the graph and chart (kibana), we can called “ELK stack” and now the name become “Elastic Stack”, why stack?? because its combination three application platform to process a log information into visualize data (my opinion)
The question is, how we can process that data to the important information and present that data to our company,client or customer in the graphic chart through Elastick Stack?
we can send data and information from system or application to ELK system in syslog streaming, then logstash will collect the log information, filter and parsing that log, and give the output to elasticsearch, in the elasticsearch we can analytic that information, filter the most important data that we need through query used elasticsearch engine and present that filter query to readable data used Kibana on graphic chart form as information data we can present to our user
Now lets action to create Elastic Stack System
we will instal Elastic + Logstash + Kibana on ubuntu system 14.04 LTS
spec minimum requirement to running ELK my recomendation is :
RAM : 8 GB
CPU : 2 Core
Disk : 40 GB
first we need update the ubuntu repository with comamnd
#sudo apt-get update
then we will installed Java 8, because Elastic Stack and logstash used java platform
======================================================================================
Install Java version 8
=====================================================================================
a. add oracle PPA repository to ubuntu system
#sudo add-apt-repository -y ppa:webupd8team/java
b. do update package
#apt-get update
c. install java 8 with command
#sudo apt-get -y install oracle-java8-installer
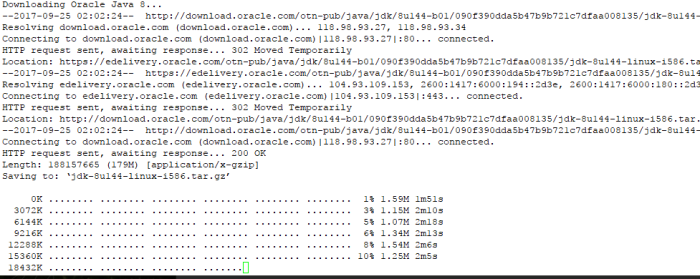
d. check java instalation with
#sudo java -version

=======================================================================================
Intsall Elasticsearch
===============================================================================================
a. Import public GPG key into apt repository
#wget -qO – https://artifacts.elastic.co/GPG-KEY-elasticsearch | sudo apt-key add –
b. Then, you will need to add Elastic’s package source list to apt. (elastic version 5)
#echo “deb https://artifacts.elastic.co/packages/5.x/apt stable main” | sudo tee -a /etc/apt/sources.list.d/elastic-5.x.list
you can check aptitude source list on yur system in /etc/apt/sources.list.d/
c. update repository on your system with command
#sudo apt-get update

d. install elasticsearch with command
#sudo apt-get install elasticsearch

Note : if you refer another source tutorial and they try to install elastic version 2, its not valid anymore, i try used elastic package version 2 , and the result is “unable to locate package elasticsearch”, like on the picuture below


e. Next you will restrict outside access to your Elasticsearch instance (port 9200), so outsiders can’t read your data or shutdown your Elasticsearch through the HTTP API.
Find the line that specifies “network.host“, uncomment it, and replace its value with “localhost” so it looks like this:
Let’s edit the configuration on directory /etc/elasticsearch/elasticsearch.yml
#vim /etc/elasticsearch/elasticsearch.yml
uncoment line below and change that value to
network.host: localhost
save file config elasticsearch

and start elasticsearch service with command
#sudo service elasticsearch start
check status service elasticsearch with comamnd
#sudo service elasticsearch status
f. Next, if we want to start elastic on boot startup used command
#sudo update-rc.d elasticsearch defaults
the output should be like on the picture below
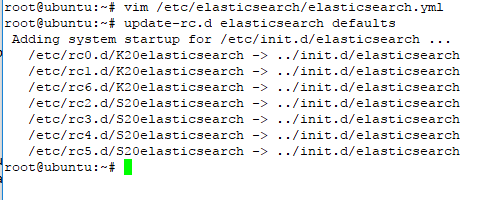
with this command ubuntu system will be refered directory /etc/init.d/elasticsearch and start all component elasticsearch on the next boot
g. You can test local elasticsearch running with the following curl command:
#curl localhost:9200
the output should be like on the picture below
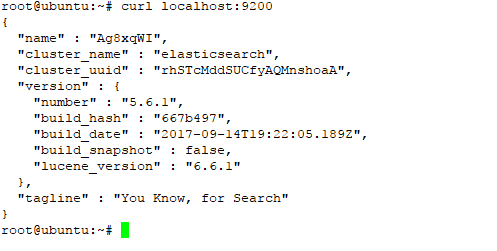
at this step we have success install elasticsearch on ubuntu system
===========================================================================
installing Logstash
===========================================================================
in this step we will install logstash as collection dynamic data and information through streaming syslog, create type input data (ex: UDP: 514) format type data (JSON or syslog), filtering data and give the output to the elasticsearch
a. to install logstash first add repository logstash to aptitude debian package
#echo ‘deb http://packages.elastic.co/logstash/2.2/debian stable main’ | sudo tee /etc/apt/sources.list.d/logstash-2.2.x.list
b. do update on repository
#sudo apt-get update

c. install logstash with command
#sudo apt-get install logstash
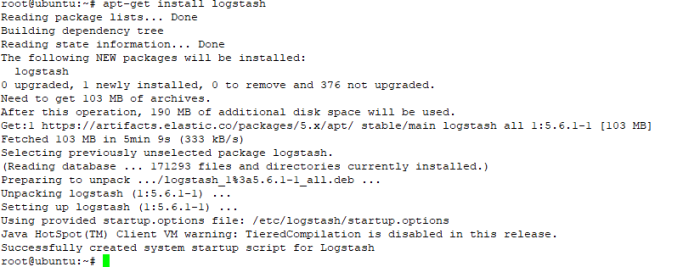
d.After installed logstash dont start that service, we must create logstash configuration first to parsing log they get from remote device about input log setting (port, protocol),format log (syslog,JSON), filter, and output where the output log will be showed, in directory configuration logstash /etc/logstash/conf.d
im split the configuration to three file there is input config , filter config, and output log config
first, create configuration input log setting, such port service will be used and the type of log streaming.
create configuration with command
#vim /etc/logstash/conf.d/input-rsyslog.conf
and add the line below to the file configuration
===========================
input-rsyslog.conf
=========================
input {
udp {
port => 1514
type=> “logs”
}
tcp {
port => 1514
type=> “logs”
}
}
================================
example picture :
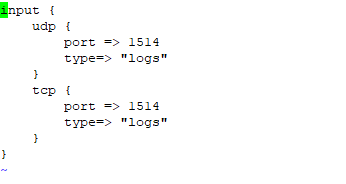
second, we will filter log data and make that data to the field information
create configuration file with command
#vim /etc/logstash/conf.d/syslog-filter.conf
add the line on the below to file configuration
===================================
syslog-filter.conf
=====================================
filter {
if [type] == “syslog” {
grok {
match => { “message” => “%{SYSLOGTIMESTAMP:syslog_timestamp} %{SYSLOGHOST:syslog_hostname} %{DATA:syslog_program}(?:[%{POSINT:syslog_pid}])?: %{GREEDYDATA:syslog_message}” }
add_field => [ “received_at”, “%{@timestamp}” ]
add_field => [ “received_from”, “%{host}” ]
}
syslog_pri { }
date {
match => [ “syslog_timestamp”, “MMM d HH:mm:ss”, “MMM dd HH:mm:ss” ]
}
}
}
=================================================================================
the last step, we will create file configuration to put the output log data on elasticsearch
create file configuration with command
#vim /etc/logstash/conf.d/output-syslog.conf
and add the line below to the configuration file
======================================================================
output-syslog.conf
=============================================================
output {
elasticsearch {
hosts => [“localhost:9200”]
}
stdout { codec => rubydebug }
}
=================================================================
this is the most important configuration part when you wanna parsing and filter data from collection data machine and generate log data to be important information you will need to analyze your system, application, security alert, or network device

and this is an example logstash configuration for noob to parsing log data, 😛
e. if you have create logstash configuration, you can test that configuration with command
#sudo -u logstash /usr/share/logstash/bin/logstash –path.settings /etc/logstash -t

the result must be “OK” if the result is not like on the picture there something wrong with your logstash configuration
if you used “sudo service logstash configtest” to test configuration logstash
u will get message error because that command not available on this logstash version

f. start logstash with command
#service logstash start
check logstash status with command
#sudo service logstash status

g. check input service port listening logstash used to collect log streaming from remote device/system/application
on the configuration logstash input, we have defined port service input will be used UDP 1514 and TCP 1514 to collect log data from remote device
check port service to ensure your logstash machine is ready to collect data with command
#netstat -na | grep 1514
#netstat -an | grep udp

h. for start logstash service on bootup startup ,used command
#sudo initctl start logstash
if you used command below
“update-rc.d elasticsearch defaults” its not valid anymore
This is because in new version Logstash automatically detects the startup system of the system in use and deploys the correct startup scripts.
=============================================
install kibana
===========================================
we used kibana to visualize result query log information used elasticsearch from log data collection logstash to present that information to readable graph, chart, count, and pie
a. to install kibana firt we must add kibana repository to your ubuntu with command
#sudo echo “deb http://packages.elastic.co/kibana/4.4/debian stable main” | sudo tee -a /etc/apt/sources.list.d/kibana-4.4.x.list
b. do update with command
#sudo apt-get update
c. install kibana with command
#sudo apt-get -y install kibana

d. after success installed edit konfig kibana yml with command
#sudo vim /etc/kibana/kibana.yml
change the specific line to the value like on the below
server.port: 5601
server.host: localhost

starts kibana with command
#service kibana start
and for configuration start service on boot startup , used this command
#sudo update-rc.d kibana defaults
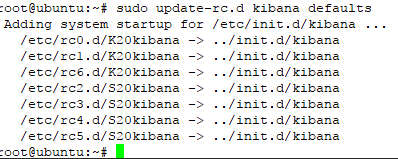
in this step, you have success intalled and configure three main component Elastic Stack (elasticsearch, logstash, and Kibana)
=========================================================
install nginx
====================================================
if we follow the instruction on the above and success, actualy right now we can direct access to eLK through port 5601 kibana, but on this case wee need proxy to masking port service ELK web admin and create login authoriztion username and pasword admin if we want to access ELK web config, so we need NGINX proxy to mapping port and install apache2-utils to create admin cridential login
install Nginx with command
#sudo apt-get install nginx
You will also need to install apache2-utils for htpasswd utility:
#sudo apt-get install apache2-utils
Now, Create admin user to access Kibana web interface using htpasswd utility:
#sudo htpasswd -c /etc/nginx/htpasswd.users admin
Enter password as you wish, you will need this password to access Kibana web interface.
Next, open Nginx default configuration file:
used this comamnd to configure nginx
#sudo vim /etc/nginx/sites-available/default
Delete or comment the all lines and add the following lines:
=================================================
server {
listen 80;
server_name 192.168.1.7;
auth_basic “Restricted Access”;
auth_basic_user_file /etc/nginx/htpasswd.users;
location / {
proxy_pass http://localhost:5601;
proxy_http_version 1.1;
proxy_set_header Upgrade $http_upgrade;
proxy_set_header Connection ‘upgrade’;
proxy_set_header Host $host;
proxy_cache_bypass $http_upgrade;
}
}
============================================================
restart nginx and the result must be OK
finaly we can access Elastic Stack through ip server http://<ip server>
fill credential username and password to access Elastic Stack, if success we will se first window after installation Elastic Stack like on the picture below
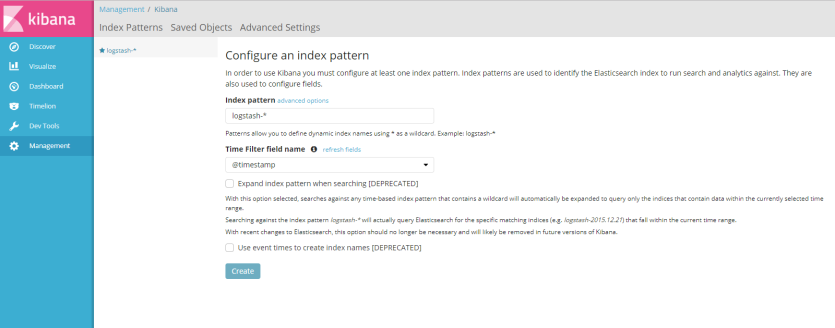
like information said ont the picture above, to used kibana we must configure at least one index patern are used to identify the elasticsearch to run search and analytics againts, and to configure index patern we need sample log file or syslog streaming to Elastic Stack, if you dont have example log data you cant create index pattern
in this example i sent syslog message from my virtual BIG-IP to ELK server, configure BIG-IP to sent syslog message to IP address of Elestic Stack used port 1514 and i success create index patern for Elastic Stack with click button “create”
after create index pattern we will see all syslog message from virtual BIG-IP on menu “discover”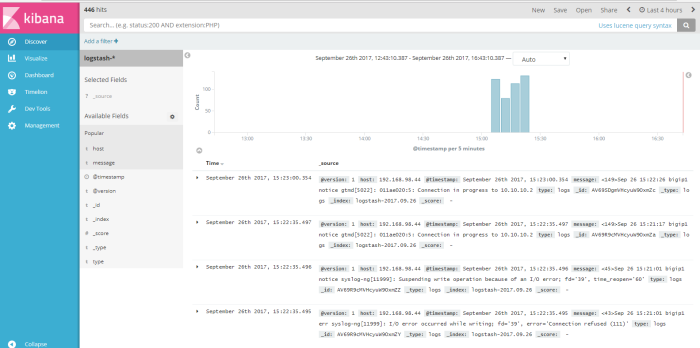
this menu is output data shown from logstash dynamic collection data, from this menu we can do a query search to log data to get information we need to analyze our system or application, we can filter the query search from available field to find a specific information, for example i wanna do a simple query from log data about how many log message send from host 192.168.98.44, so i “add filter” used field “host” logic filter “is” and the value a field host is “192.168.98.44” like on the picture below
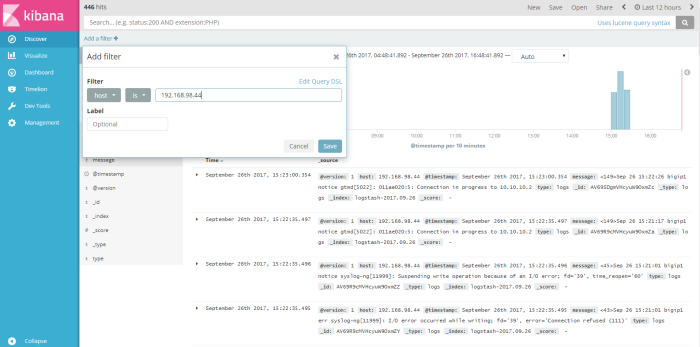
click “save” to save the filter, and the result of our filter will be shown on the picture below
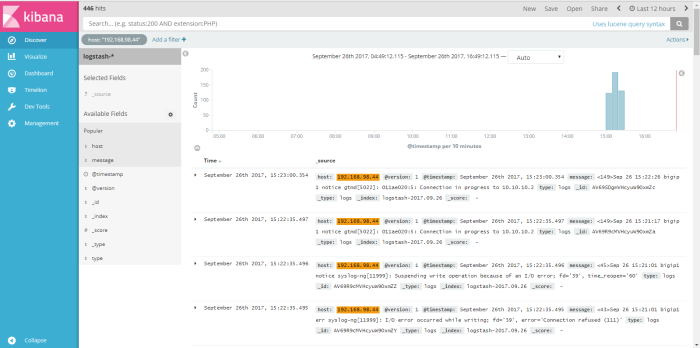
we can save the result filter to a profile name, with click save button on the top right window and then used that result filter into visual graph through menu “visualize”
on menu visualize we will create new profile like on the picture below

click button “create new visualization” and choose type visualize will be used to visualize result query information
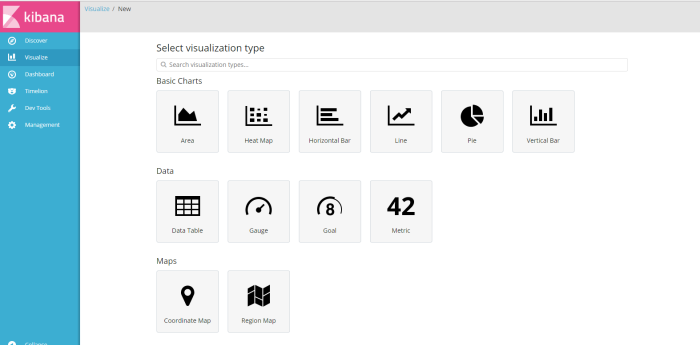
for this example i choose type “vertical bar” charts as visualize result from query filter log profile from menu discover i have created before named “host”, filter information how many log message from source host 192.168.98.44 ,
at the second example i will back to menu discover and create new filter to find message how many “connection in progress” we can get on syslog data, add filter and used “message” as filtering field “is” as logical filter and the value of field message is “connection on progress” and the result shown like on the picture below
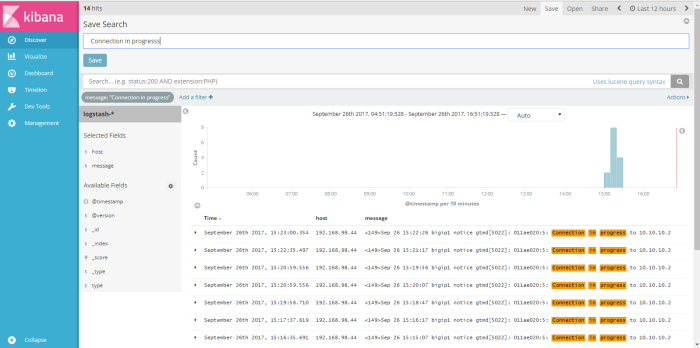
we can save that filter result as profile name, i save search filter with name “connection in porgress, next i will visualize my filter search through menu “visualize”
from menu visualize click “create new visualization” for the type of visualize i choose “count”, next i will choose data information source i will visualize, i choose result of search filter from menu discover i have created before “connection in progress”
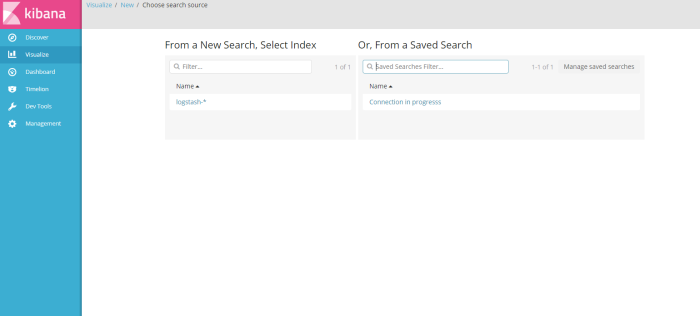
and the result shown like on the picture below
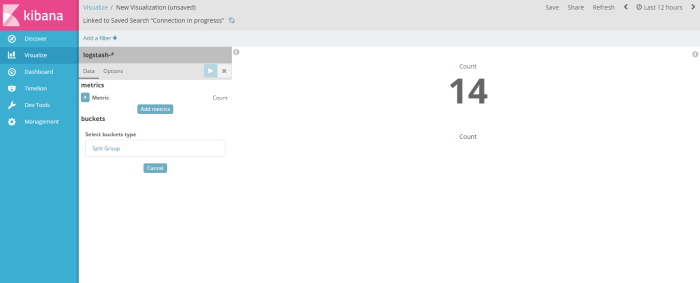
after visualize the result filter dont forget to save that visaulization template to be a profile, in this example i save the visualization profile with name “count”
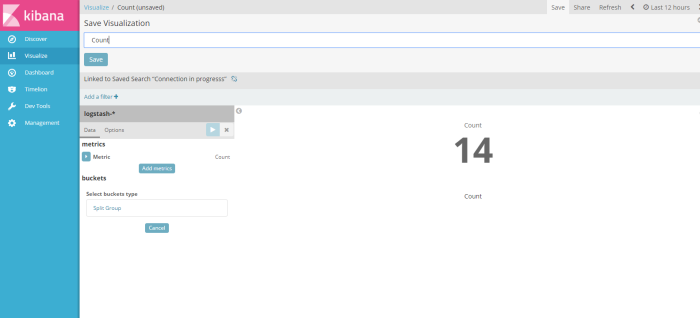
after visualize the result of filter information i will present all result filter search and chart to dashboard from menu “dashboard”
from menu dahsboard click add to create a dashboard profile

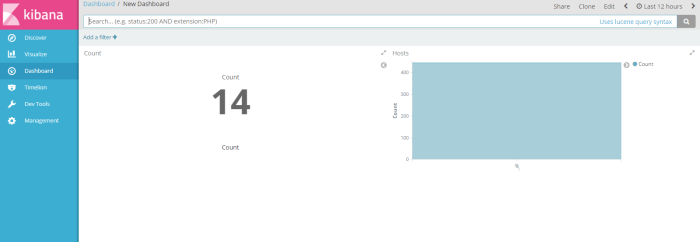
and the choose visualization profile have you crated to be shown on the dashboard, of course i choose 2 profile visualization i have created (host and Count) sample dashboard will be shown like on the picture below
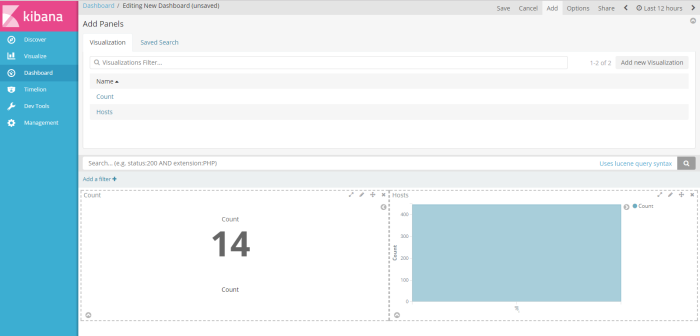
next, click save button on the right corner window to save the profile as new dashboard profile, i save as “New Dashboard”
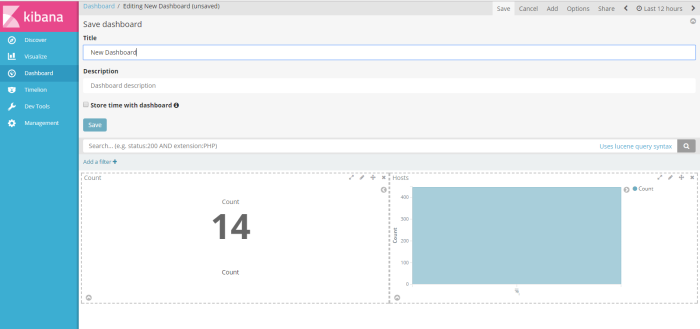
and then finnaly you have a new dashboard to infrom you, to your management or user about important information on your system status, security alert or application service alert, have you filter through query elasticsearch, from unstructure log data collected by logstash into readable chart by kibana, Good Luck
